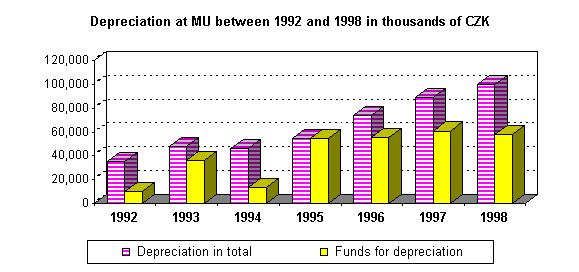
Today, when we are evaluating the course of 1998, we are able to state that in spite of the unfavourable development of the Czech economy, the university management succeeded in not only keeping the level reached in previous years but in improving a whole range of economic indicators, as documented in the following figures and graphs which compare the development of MU over the past 5–10 years.
When compared to economic results of other Czech schools of higher education, the economic results achieved in 1998 by MU stand out. This evaluation, however, should be considered by the appropriate ministry from which we expect a reflection of this situation in its differentiation of financial policy. This issue will gain great weight as early as 1999 when the funding of schools of higher education will be transformed into a form of appropriation and when the new body of a board of directors will be introduced to the management of each school of higher education (in effect from January 1, 1999, in accordance with the new Act on Higher Education).
In general, it is necessary to point out that in spite of the initial difficulties in dividing allowances for individual faculties (which in many cases did not reach 95 % of their declared needs), the financial means were spent proportionally in the course of the whole year and MU financial reserves were activated. The University focused on the implementation of grant and economic activities, a move which positively influenced MU income. The stagnation of 1997 was surmounted, and the output curve of 1998 went up again.
In 1998, Masaryk University achieved a positive economic result amounting to CZK 24.5 million. It is necessary, however, to point out that more then CZK 20 million of the total economic income comes from MU economic activities.
The results of 1998 are best recorded in numbers and trends of selected indicators which represent the management of MU.
In 1997, MU received CZK 98.6 million from grants. In 1998 the grant income increased to CZK 149.2 million, a sum which is CZK 13.7 million higher then the amount received in 1996. This proves that 1998 was the most successful year for the MU grant policy so far.
In comparison with 1997, the income from MU economic activities increased considerably, too. While the economic activities of 1997 amounted to approximately CZK 100 million, last year the sum amounted to CZK 116.695 million.
Five budget changes meant that the initial contribution of the Ministry of Education, Youth and Sport of CZK 669.448 million increased by December 31, 1998 to CZK 851.717 of non-investment financial means. In comparison to 1997, this was an increase of CZK 182 million.
As the table of financial contributions shows, the swing in research activities in 1997 had a negative impact on the state funding of creative activities at MU in 1998:
From the above-stated comparison, we may deduce the main task for 1999 for all MU departments: to ensure overall growth in all indicators observed. From this point of view we must praise highly the activities of individual MU units: the parameters of their creative output came back to an advancing curve.
The total of all MU profits in 1998 exceeded CZK 1 thousand million (to be precise: CZK 1.072 thousand million in the field of operational means). Investments create an independent part of the school budget: machinery, building and acquisition policy implemented by the university management. The slowing down in investment-building in the period of ”governmental packages” was eliminated in the first six months of 1998, and the final volume of investment money reached the level needed. In 1998, Masaryk University invested a total sum of CZK 305.5 million.
This meant a decrease in comparison with the previous year (when the level of investments, CZK 379.8 million, reached its peak). The catastrophic expectations accompanying the overall economic recession in the Czech Republic were, however, unfounded. For the evaluation of MU investment policy, an important role is played not only by the total amount of investments but also by the properties which MU managed to obtain or build.
In June 1998, the building of the Faculty of Economics and Administration at Lipová 41a was approved by building inspectors and handed over to the Faculty for use. This was the largest building project in the post-war history of Masaryk University, with total investment expenses exceeding CZK 260 million.
By December 31, 1998, reconstruction work at the Faculty of Informatics at Botanická 68a was finished. In 1999, it is necessary to complete the reconstruction of the entry hall and the outsides of the building. The Faculty of Informatics (together with the Institute of Computer Science) has all the prerequisites for it to grow and develop; the total expenses for its development reached CZK 90 million.
Masaryk University finally managed to obtain from VUT (Brno Technical University) a building on Gorkého 7. The building was renovated and at the beginning of the 1998/99 academic year handed over to the newly founded School of Social Studies. Later in the year, the School gained another building on Jaselská which will be renovated in 1999.
For the Faculty of Science, MU arranged the construction of attic rooms at Kotláoská 2 and relocated some of its departments and sections (Department of Anthropology, Institute of Earth Physics, Department of Environmental Chemistry and Ecotoxicology).
Out of the greatest achievements of 1998 was the beginning of reconstruction work on the historic building of the Faculty of Medicine at Komenského námistí 2 which was preceded by the involved process of moving of its departments to the MEDIPO site (renovated for this purpose).
The extent of investments and renovation work at the MEDIPO site in 1998 reached almost CZK 50 million of the total of CZK 200 million planned for this project.
For the purposes of the Central Concierge for Halls of Residence and Canteens, a cut-through at the Vinaoská site and a canteen for employees of the Faculty of Economics and Administration were created.
Smaller investment and reconstruction projects took place as well. This is, however, not the main task of an annual report, which should characterise in general terms the whole-year activities of Masaryk University.
The most significant acquisition and investment project of 1998 was the final securing by MU of the area to be developed in Brno-Bohunice.
First, the studies and plans of the MU campus were processed and the first stage of construction work on the Centre of Morphology of the Faculty of Medicine was implemented. But the greatest – almost an historic – success was recorded on December 31, 1998, when Masaryk University took receipt of 20 hectares of land of a market value of approximately CZK 160 million. This act has created the prerequisites for the strategic development of Masaryk University up to the year 2010.
It is possible to state that, in spite of the unfavourable economic situation which has affected the entire country, Masaryk University managed to follow a positive path: the university was able to develop its activities at the tempo and to the extent set out in 1992.
In spite of the relatively successful economic development of our university, we should not, however, overlook certain growing problems.
From January 1, 1999 Masaryk University has had to operate in a new economic, operational and legislative environment. Like every school of higher education, MU becomes by Law no. 111/98 a public school of higher education. This means – among other things – that the trend to obtain a greater amount of extra-budgetary means will be even more emphasised than in previous periods.
On top of this it is necessary to realise that the development of MU (i.e. the increasing number of MU buildings, sites, technology, equipment, etc.) brings together at the same time greater demands concerning operational costs and expenses. This issue is already relevant today. MU development plans mean that the University has to look for alternative sources of funding. There is a real possibility that the state budget will not be able to cover the whole sum needed for all MU projects. For this reason we have to be aware of and prepare for this situation. 1998 year proved that Masaryk University has all the necessary prerequisites for dealing with such a situation.
Table 1 – Number of students in comparison with number of employees 1991 – 19981991 |
1992 |
1993 |
1994 |
1995 |
1996 |
1997 |
1998 |
|
| Number of students | 9 728 |
10 575 |
11 544 |
11 629 |
12 837 |
15 401 |
16 741 |
18 026 |
| Number of employees | 2 182 |
2 232 |
2 309 |
2 309 |
2 275 |
2 435 |
2 458 |
2 477 |
| Student/employee | 4.46 |
4.74 |
5.00 |
5.04 |
5.64 |
6.32 |
6.81 |
7.28 |

Table 2 – Statistics of employees and students – 1998
Employees |
Degree students |
All students |
|||||||||
Faculty |
teachers |
others |
total |
number |
student/ |
student/ |
student/ |
number |
student/ |
student/ |
student/ |
FM |
293.67 |
238.75 |
532.42 | 1 693 |
5.76 |
7.09 |
3.18 |
1 881 |
6.41 |
7.88 |
3.53 |
FA |
170.33 |
86.00 |
256.33 | 2 792 |
16.39 |
32.47 |
10.89 |
3 115 |
18.29 |
36.22 |
12.15 |
FL |
76.54 |
66.84 |
143.38 | 2 309 |
30.17 |
34.55 |
16.10 |
2 528 |
33.03 |
37.82 |
17.63 |
SchSS |
24.32 |
21.31 |
45.63 | 607 |
24.96 |
28.48 |
13.30 |
617 |
25.37 |
28.95 |
13.52 |
FS |
196.76 |
277.92 |
474.68 | 2 197 |
11.17 |
7.91 |
4.63 |
2 232 |
11.34 |
8.03 |
4.71 |
FI |
28.66 |
53.95 |
82.61 | 948 |
33.08 |
17.57 |
11.48 |
1 006 |
35.10 |
18.65 |
12.18 |
FE |
219.40 |
112.03 |
331.43 | 3 533 |
16.10 |
31.54 |
10.66 |
4 413 |
20.11 |
39.39 |
13.32 |
FEA |
60.38 |
47.40 |
107.78 | 1 969 |
32.61 |
41.54 |
18.27 |
1 992 |
32.99 |
42.03 |
18.48 |
Others |
80.75 |
187.25 |
268.00 | 0 |
0 |
0 |
0 |
242 |
3.00 |
1.29 |
0.90 |
CCHRC* |
0 |
235.05 |
235.05 | 0 |
0 |
0 |
0 |
0 |
0 |
0 |
0 |
Total |
1 150.81 |
1 326.5 |
2 477.31 | 16 048 |
13.94 |
12.10 |
6.48 |
18 026 |
15.66 |
13.59 |
7.28 |
Table 3 – Non-investment means per student 1991 – 1998 in thousands of CZK
1991 |
1992 |
1993 |
1994 |
1995 |
1996 |
1997 |
1998 |
|
| Non-investment funding of Ministry of Education, Youth and Sport | 296 420 |
312 950 |
425 123 |
518 252 |
637 285 |
728 155 |
751 761 |
851 717 |
| Number of students | 9 728 |
10 575 |
11 544 |
11 629 |
12 837 |
15 401 |
16 741 |
18 026 |
| Non-investments / student | 30.47 |
29.59 |
36.83 |
44.53 |
49.64 |
47.28 |
44.91 |
47.25 |
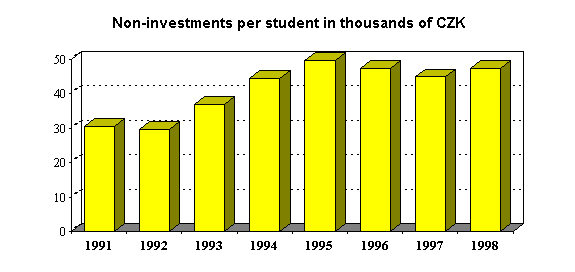
Table 4 – Non–investment means gained from grants between 1992 and 1998 in thousands of CZK
Faculty |
1992 |
1993 |
1994 |
1995 |
1996 |
1997 |
1998 |
FM |
173 | 3 286 | 6 346 | 6 994 | 12 474 | 13 962 | 13 449 |
FA |
2 196 | 2 034 | 4 660 | 4 786 | 6 794 | 2 290 | |
FL |
28 | 10 | 88 | 78 | 207 | 251 | |
SchSS |
3 354 | ||||||
FS |
2 187 | 7 743 | 10 733 | 10 437 | 17 067 | 22 507 | 32 649 |
FI |
310 | 2 870 | 934 | 523 | 3 656 | ||
FE |
2 930 | 1 196 | 2 021 | 900 | 984 | 1 756 | 1 966 |
FEA |
386 | 80 | 157 | 1 048 | 1 282 | 1 496 | 1 952 |
Others |
7 888 | 15 134 | 24 631 | 15 133 | 4 027 | 8 683 | |
of this: |
|||||||
RO |
500 | 170 | 316 | 156 | |||
ICS |
21 460 | 14 212 | 2 900 | 7 840 | |||
CFET |
2 671 | 751 | 811 | 687 | |||
Total |
5 956 | 22 399 | 36 735 | 51 628 | 52 738 | 51 272 | 68 250 |
Table 5 – Investment means gained from grants between 1992 and 1998 in thousands of CZK
| Faculty | 1992 |
1993 |
1994 |
1995 |
1996 |
1997 |
1998 |
FM |
1 260 | 2 500 | 9 526 | 3 823 | 1 832 | 2 879 | |
FA |
352 | 519 | 1 524 | 1 499 | 1 123 | 1 380 | |
FL |
75 | 40 | 594 | 55 | |||
SchSS |
1 325 | ||||||
FS |
305 | 2 353 | 5 690 | 5 245 | 45 521 | 19 298 | 21 737 |
FI |
40 | 2 170 | 3 140 | 1 689 | 7 923 | ||
FE |
187 | 233 | 188 | 221 | 138 | 340 | 610 |
FEA |
45 | 157 | 33 | 0 | 0 | 611 | |
Others |
10 049 | 19 153 | 19 903 | 28 665 | 17 077 | 31 327 | |
of this: |
|||||||
RO |
30 | 0 | 100 | ||||
ICS |
19 713 | 28 635 | 17 077 | 31 227 | |||
CFET |
190 | 0 | 0 | 0 | |||
Total |
492 | 14 292 | 28 090 | 38 697 | 82 826 | 41 953 | 67 847 |
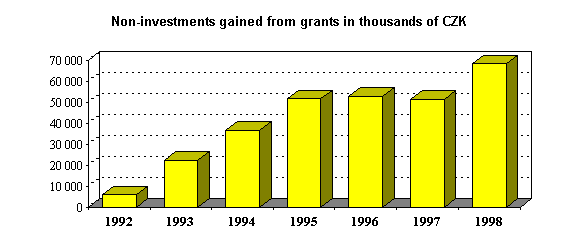

Table 6 – Means for wages gained between 1993 and 1998 in thousands of CZK
Faculty |
1993 |
1994 |
1995 |
1996 |
1997 |
1998 |
FM |
82 | 834 | 995 | 1 644 | 3 448 | 3 487 |
FA |
88 | 932 | 1 405 | 1 286 | 1 845 | 711 |
FL |
15 | 41 | 42 | 78 | ||
SchSS |
1 419 | |||||
FS |
238 | 1 510 | 2 375 | 3 440 | 5 971 | 8 071 |
FI |
75 | 40 | 106 | 1 186 | ||
FE |
655 | 754 | 146 | 184 | 334 | 629 |
FEA |
137 | 12 | 519 | 294 | 415 | 670 |
Others |
1 810 | 948 | 1 528 | 693 | 504 | 557 |
of this: |
||||||
RO |
30 | 80 | 30 | 30 | ||
ICS |
38 | 188 | 275 | 170 | 158 | |
CFET |
1 772 | 730 | 1 528 | 338 | 304 | 369 |
Total |
3 010 | 4 990 | 7 058 | 7 622 | 12 665 | 16 808 |

Table 7 – Earnings from economic activities between 1991 and 1998 in thousands of CZK
Faculty |
1993 |
1994 |
1995 |
1996 |
1997 |
1998 |
FM |
5 610 | 19 816 | 29 949 | 32 617 | 37 071 | 43 351 |
FA |
1 804 | 4 003 | 3 293 | 1 946 | 2 422 | 3 890 |
FL |
9 686 | 19 030 | 14 083 | 20 698 | 18 083 | 20 416 |
SchSS |
375 | |||||
FS |
7 240 | 8 786 | 9 349 | 9 254 | 9 712 | 14 773 |
FI |
691 | 180 | 163 | |||
FE |
1 456 | 465 | 860 | 1 376 | 1 185 | 1 190 |
FEA |
1 274 | 2 924 | 3 478 | 2 526 | 3 087 | 3 078 |
Others |
5 671 | 11 319 | 24 184 | 31 089 | 27 955 | 29 459 |
Total |
32 741 | 66 343 | 85 196 | 100 197 | 99 695 | 116 695 |
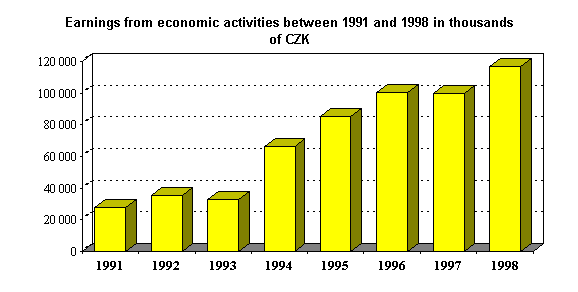
Table 8 – Financial means gained from teachers’ grants 1992 – 1998 in thousands of CZK
1992 |
1993 |
1994 |
1995 |
1996 |
1997 |
1998 |
|
| Means from grants | 6 448 |
39 701 |
69 815 |
97 383 |
135 564 |
93 225 |
136 097 |
| Number of teachers | 1 049 |
1 079 |
1 107 |
1 089 |
1 135 |
1 145 |
1 151 |
| Grant / teacher | 6.15 |
36.79 |
63.07 |
89.42 |
119.44 |
81.42 |
118.26 |

Table 9 – Means gained from economic activities per employee 1991 – 1998 in thousands of CZK
1991 |
1992 |
1993 |
1994 |
1995 |
1996 |
1997 |
1998 |
|
| Means from econ. activities | 28 070 |
35 583 |
32 741 |
66 343 |
85 196 |
100 197 |
99 695 |
116 695 |
| Number of employees | 2 182 |
2 232 |
2 309 |
2 309 |
2 275 |
2 435 |
2 448 |
2 477 |
| Economic activity / employee | 12.86 |
15.94 |
14.18 |
28.73 |
37.45 |
41.15 |
40.72 |
47.11 |
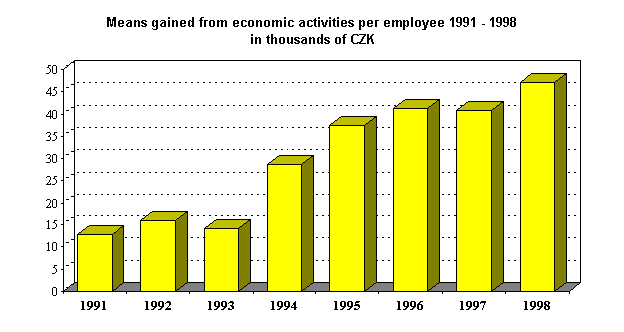
Table 10 – MU employees 1990 - 1998 (teachers)
| Faculty | 1990 |
1991 |
1992 |
1993 |
1994 |
1995 |
1996 |
1997 |
1998 |
FM |
315.0 | 314.4 | 322.1 | 320.1 | 309.3 | 305.0 | 290.5 | 294.71 | 293.67 |
FA |
159.4 | 173.2 | 175.7 | 179.4 | 183.8 | 188.6 | 186.6 | 191.71 | 170.33 |
FL |
50.5 | 57.8 | 62.5 | 69.5 | 71.3 | 73.3 | 70.5 | 74.72 | 76.54 |
SchSS |
24.32 | ||||||||
FS |
181.2 | 200.4 | 211.0 | 208.4 | 202.5 | 195.3 | 200.0 | 195.86 | 196.76 |
FI |
6.6 | 20.7 | 24.5 | 28.32 | 28.66 | ||||
FE |
181.9 | 193.5 | 197.7 | 205.5 | 225.8 | 232.5 | 233.5 | 226.97 | 219.40 |
FEA |
8.6 | 13.2 | 21.2 | 29.9 | 47.2 | 57.0 | 58.29 | 60.38 | |
Others |
81.4 | 54.2 | 67.0 | 75.0 | 78.2 | 72.6 | 72.7 | 74.06 | 80.75 |
Total |
969.4 | 1 002.1 | 1 049.2 | 1 079.1 | 1 107.4 | 1 135.2 | 1 135.3 | 1 144.64 | 1 150.81 |
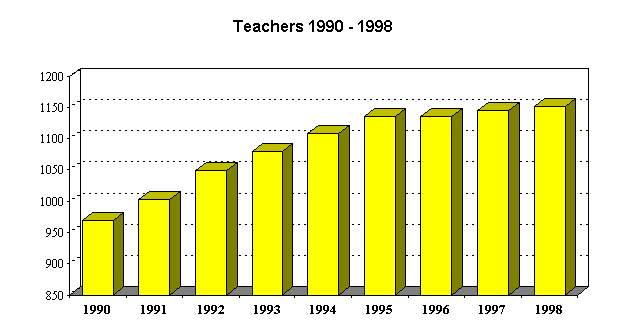
Table 11 – MU employees 1990 – 1998 (non-teaching staff)
| Faculty | 1990 |
1991 |
1992 |
1993 |
1994 |
1995 |
1996 |
1997 |
1998 |
FM |
278.8 | 277.4 | 268.5 | 271.1 | 267.0 | 269.6 | 269.0 | 269.82 | 238.75 |
FA |
84.3 | 88.5 | 88.5 | 93.7 | 93.2 | 88.1 | 92.9 | 96.34 | 86.00 |
FL |
42.2 | 57.2 | 54.0 | 66.9 | 65.3 | 80.5 | 72.9 | 69.13 | 66.84 |
SchSS |
21.31 | ||||||||
FS |
234.3 | 223.7 | 226.9 | 234.5 | 232.8 | 245.3 | 247.8 | 264.51 | 277.92 |
FI |
19.7 | 36.1 | 40.99 | 53.95 | |||||
FE |
115.1 | 105.9 | 102.1 | 101.1 | 103.3 | 112.9 | 117.3 | 116.71 | 112.03 |
FEA |
29.6 | 26.5 | 27.4 | 29.7 | 40.5 | 45.5 | 39.17 | 47.40 | |
Others |
206.3 | 179.9 | 196.3 | 196.4 | 180.5 | 187.7 | 189.5 | 192.96 | 187.25 |
CCHRC* |
255.6 | 217.7 | 220.0 | 230.6 | 226.2 | 217.8 | 228.3 | 224.19 | 235.05 |
Total |
1 216.6 | 1 179.9 | 1 182.8 | 1 219.7 | 1 202.0 | 1 262.1 | 1 299.3 | 1 313.82 | 1 150.81 |
* Central Concierge for Halls of Residence and Canteens
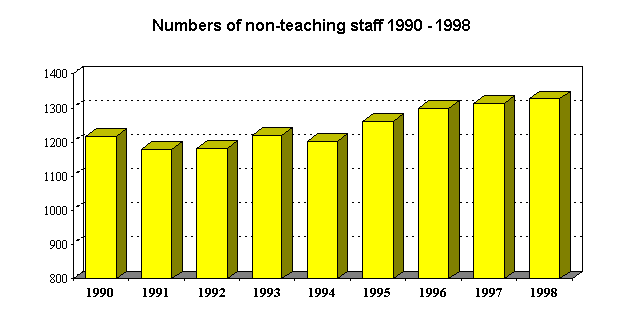
Table 12 – Budget non-investment means 1991 – 1998 in thousands of CZK
| 1991 | 1992 |
1993 |
1994 |
1995 |
1996 |
1997 |
1998 |
296 420 |
312 950 |
425 123 |
518 252 |
637 285 |
728 155 |
751 761 |
851 717 |
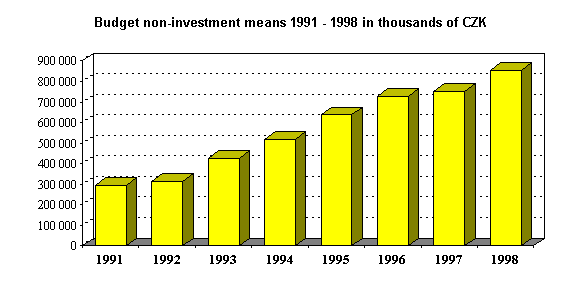
Table 13 – Costs for the maintenance of MU buildings 1991 – 1998 in thousands of CZK
| Year | 1991 |
1992 |
1993 |
1994 |
1995 |
1996 |
1997 |
1998 |
| Amount | 9 451 |
17 061 |
19 738 |
22 155 |
21 192 |
41 023 |
48 685 |
63 833 |
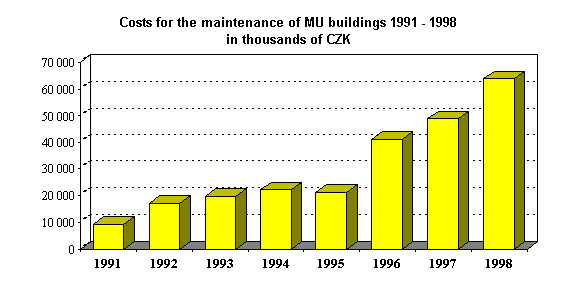
Table 14 – Immovable assets 1991 – 1998 in thousands of CZK
1991 |
1992 |
1993 |
1994 |
1995 |
1996 |
1997 |
1998 |
172 768 |
198 978 |
214 478 |
232 465 |
410 972 |
490 902 |
556 326 |
811 241 |
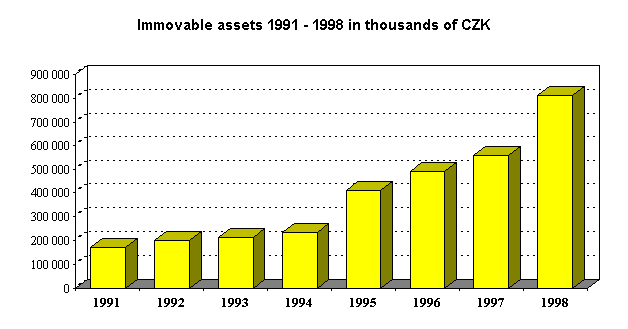
Table 15 – MU movable assets 1991 - 1998 in thousands of CZK
1991 |
1992 |
1993 |
1994 |
1995 |
1996 |
1997 |
1998 |
372 787 |
418 367 |
461 685 |
506 541 |
614 659 |
728 618 |
828 203 |
938 231 |
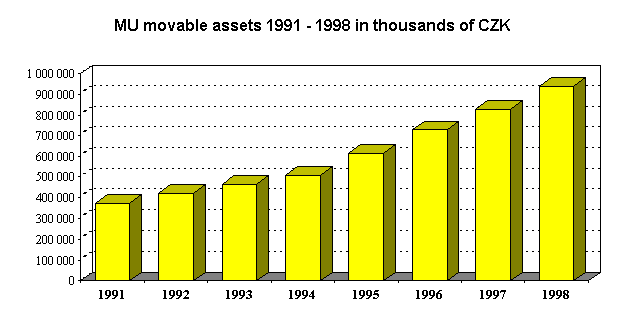
Table 16 – Depreciation at MU 1992 – 1998 in thousands of CZK
1992 |
1993 |
1994 |
1995 |
1996 |
1997 |
1998 |
|
| Property depreciation | 35 220 | 36 395 | 39 696 | 44 946 | 60 755 | 79 169 | 94 963 |
| Depreciation from economic result of previous year |
11 210 | 6 329 | 9 729 | 12 843 | 10 000 | 5 181 | |
| Total depreciation | 35 220 | 47 605 | 46 025 | 54 675 | 73 598 | 89 169 | 100 144 |
| Funds for depreciation | 10 000 | 36 355 | 13 588 | 54 435 | 55 397 | 60 801 | 57 544 |
