The
year 2000 marks the end of the decade of MU annual reports in which the
development of selected indices characterizing the financial performance of
Masaryk University and documenting its results in individual years between
1991 and 2000 were monitored.
With
this in mind, I am going to focus this year's comments, traditionally
accompanied with tables and graphs, in two directions:
evaluation
of the year 2000
comparison
with annual results of the past decade.
The year 2000, as mentioned in the MU 1999 annual report,
was perceived as a very important year for a number of reasons:
most
importantly, the year 2000 was the first year when public schools of
higher education in the CR operated in a stabilized legislative and
property situation following the adoption of Act 111/98 Sb. in the
watershed year 1999;
MoEYS
decided to change the basic normative subsidy allocation system and
introduced a new system whereby education activity subsidies are allocated
via study programmes;
the
total volume of non-investment funds for Public Schools of Higher
Education in 2000 again failed to reach the necessary level, which, as in
previous years, meant that Public Schools of Higher Education and,
consequently also MU Brno, operated with insufficient resources;
fundamental
systemic changes were made in university regulations for allocation of
resources when the negotiated procedure between MU and its faculties was
discontinued and funds for the year 2000 were distributed according to an
agreed algorithm emphasizing the duty to generate the missing resources
with one's own activities.
Financial results of the year 2000 should be viewed
through the prism of the above factors. For the sake of objectivity, it
should also be noted that the MoEYS failed to provide additional financing
corresponding to the increase in the number of students in spite of the
arguments of the developing faculties and study disciplines on the one hand
and the decision of MU management to maintain the rate of development of MU
infrastructure unchanged. The year 2000 was also significantly influenced by
the decision of the Ministry to assign a common (lower) demand coefficient to
study programmes for teachers, which, in the case of MU, was particularly
damaging for the Faculty of Science. This was the situation in 2000, framed by
operation requirements from faculties based on the price development in
1999-2000, which in the initial stage of internal university allocation of
subsidies led to a budget deficit of about 50 million CZK. In spite of the
negative sign before the economic result figures for the year 2000, it should
therefore be viewed as a success.
The net loss in the year 2000 was 2.236 million CZK.
We
should, however, also admit that in the second half of 2000 it was necessary
to set up reserves that were eventually used to cover the most complicated
cases of operational losses. The year 2000 showed the need for central MU
interventions without which the MU overall results would have been much worse.
The
overall MU performance in 2000 is given in tables and graphs below,
documenting the fact that in spite of the loss incurred in the year, some
remarkable results were also achieved that practically eliminated the initial
handicap of insufficient MU financing.
It
is, however, necessary to view the situation at MU in 2000 critically and to
introduce such organisational and economic measures that would return the MU
economic performance to a level that will guarantee a shift back in the black.
A
number of parameters in the results of the year 2000 indicate that a turning
point has been reached. It will,
however, be necessary to focus attention to the behaviour and economics of the
Medical Faculty, Faculty of Arts and the Faculty of Education, which were
largely responsible for the loss incurred by MU, although their reasons were
different.
A
long-term assessment of the university's performance that takes into account
the trends of the past decade will show that in the past 10 years MU expanded
at a rate unprecedented in its 81-year history. The expansion of MU on the one
hand and insufficient subsidy appropriation on the other are the reasons for
the accounting loss.
In
spite of the increase in non-investment subsidies from 296 million in 1991 to
924.6 million in 2000, the funding lags behind the MU developmental needs.
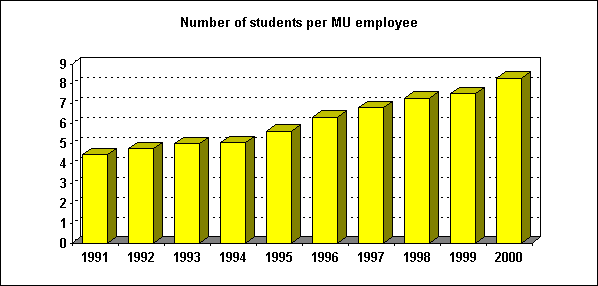
The
number of MU students increased from 9.7 thousand in 1991 to 21 thousand in
the year 2000, Over the decade, the student/staff ration increased from 4.46
to 8.29, which is a proof of increasing MU efficiency without any adverse
affects on the quality of outputs.
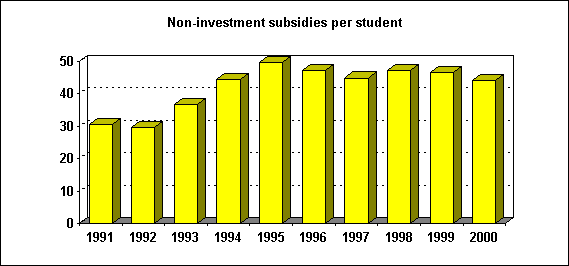
MU,
just like the rest of other Public Schools of Higher Education in the CR, has
not yet recovered from the fluctuating budgets period between 1995 and 1999.
This is reflected in one of the indices monitored, i.e. non-investment funds
per student, which was 44.0 in the year 2000 compared with 46.62 in 1999
and 49.64 in 1995.
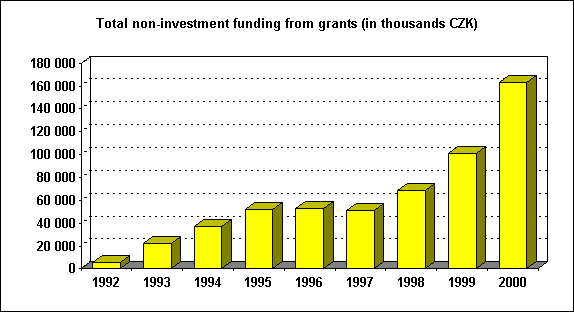
A
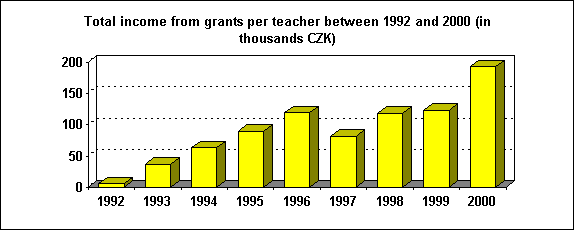
very important result was the annual increase of about 63 million CZK in non-investment
funds from special-purpose grants to reach a total of 163 million CZK in the
year 2000.
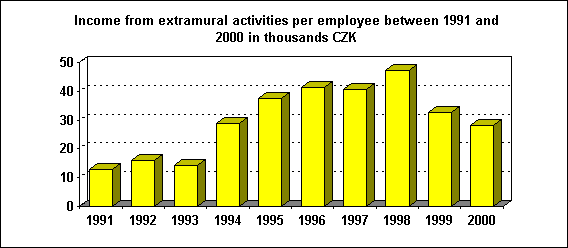
Compared
with the past decade, all indices show a dynamic growth with the exception of
extramural activities where in the past two years we have been trying to
identify reasons for lower earnings.
If
we ask why, in spite of a number of positive trends, our economic results
showed a loss, although a small one, in the past two years, we might find the
answer in specific indices that characterize the overall situation:
The
development of MU is not accompanied by an equally dynamic process in
state subsidies, particularly for educational activities, and MU has not
been able to generate enough income by its own activities to compensate
for the difference.
The
development of university infrastructure means relatively fast-growing
depreciations, which non-profit organisations like MU must cover mainly
from operating resources that, in turn, come mainly from subsidies.
Depreciations thus have a negative impact on MU management of operating
costs.
The situation might be resolved by a combination of
systemic changes in appropriation policies at the ministerial level and an
increase in income from MU's own activities. These also are the objectives of
tasks set by the MU management.
Investments, as in previous years, are an independent part
of evaluation in 2000.
From
the MU infrastructure development point of view, the previous year was, just
as the years before, successful.
The financial plan of investments was fulfilled. In the
case of the largest structure, the Morphological Centre I, payments from the
Investment Property Reproduction Fund were partly transferred to the 1st
quarter of 2001 to ease the situation in large-scale maintenance projects in
2000.
Our
major achievement is the start of construction work at the Bohunice site. The
above-mentioned Morphological Centre I and the successful completion of
architectural competition for the university campus are the events that
determine the conditions for the MU development in 2001 2006. The start
the construction of the library for the Faculty of Arts and School of Social
Studies paid the long-term internal debt to the two institutions.
After
the completion of the project in 2001, it will be possible to focus the
attention to MU, and the Bohunice university campus in particular.
Although
other capital investment construction projects were under way at halls of
residence, Faculty of Science and Faculty of Informatics, the main thrust of
our efforts in 2000 was directed to the above key projects, whose completion
in 2001 is a precondition for the start of construction work at the campus,
which has been the MU objective since 1992.
The year 2000 has brought us nearer to the construction of
the university campus in Bohunice. The realistic date for the start of
construction works is the year 2002, when the Ministry of Education is to
provide for the repayment of the planned loan, although some work is to be
done on the site even in 2001.
In 2000, two steps essential for the start of the
construction work were made:
in
December 2000, MU and the City of Brno executed a technical infrastructure
contract worth 300 million CZK;
in
November 2000, the Minister of Education confirmed the priority status of
the Bohunice campus and reiterated the commitment to finance it through a
long-term loan and repay the loan from the funds of the Ministry.
The
programme of capital investments in 2000 was, however, much broader than the
above two key construction projects and included a number of other
construction, grant and R&D
projects. Their specifications are given in tables below.
To
conclude the survey of financial performance in the year 2000 we can state
that the loss, reduced over the year to approximately 2.3 million CZK, is a
manageable problem provided it is tackled as early in 2001 as possible in
order to prevent its escalation.
The
extent of positive results in selected economic indices and the trends
established in individual parts of the university, particularly those at
selected faculties, are a promise for the future.
The
tasks for the year 2001 for the faculties that failed in 2000 are clear. They
can be summarized as follows: to reduce costs and increase the income. There
is no other option but to fulfil the task and thus to enhance MU goodwill.
That is a task for the MU management at all levels, particularly when we are
applying for loans from international institutions for the building of the
campus. The final achievement of the objective is a task not only for the
faculties and departments in financial straits. It is a task for the
university as a whole, as well as for all of its constituent parts. And that
is our task for the year 2001.
Tab. 1 The development of students-to-employees ratios between 1994 and 2000
|
1991 |
1992 |
1993 |
1994 |
1995 |
1996 |
1997 |
1998 |
1999 |
2000 |
|
|
Number of students |
9 728 |
10 575 |
11 544 |
11 629 |
12 837 |
15 401 |
16 741 |
18 026 |
18 785 |
21 014 |
|
Number of employees |
2 182 |
2 232 |
2 309 |
2 309 |
2 275 |
2 435 |
2 458 |
2 477 |
2 497 |
2 534 |
|
Student/employees |
4,46 |
4,74 |
5,00 |
5,04 |
5,64 |
6,32 |
6,81 |
7,28 |
7,52 |
8,29 |

Tab. 2 Numbers of employees and students in the year 2000
|
|
Employees |
Degree students |
All students |
||||||||
|
Faculty |
teachers |
others |
Total |
number |
student/ |
student/ |
student/ |
number |
student/ |
student/ |
student/ |
|
FM |
304,58 |
221,58 |
526,16 |
2152 |
7,07 |
9,71 |
4,09 |
2152 |
7,07 |
9,71 |
4,09 |
|
FA |
168,82 |
83,53 |
252,35 |
3212 |
19,03 |
38,45 |
12,73 |
3556 |
21,06 |
42,57 |
14,09 |
|
FL |
73,79 |
61,49 |
135,28 |
2403 |
32,57 |
39,08 |
17,76 |
2403 |
32,57 |
39,08 |
17,76 |
|
SchSS |
36,77 |
32,45 |
69,22 |
1304 |
35,46 |
40,18 |
18,84 |
1304 |
35,46 |
40,18 |
18,84 |
|
FS |
203,77 |
294,52 |
498,29 |
2452 |
12,03 |
8,33 |
4,92 |
2452 |
12,03 |
8,33 |
4,92 |
|
FI |
48,13 |
48,99 |
97,12 |
1484 |
30,83 |
30,29 |
15,28 |
1487 |
30,90 |
30,35 |
15,31 |
|
FE |
216,41 |
113,04 |
329,45 |
4057 |
18,75 |
35,89 |
12,31 |
4638 |
21,43 |
41,03 |
14,08 |
|
FEA |
61,86 |
55,31 |
117,17 |
2333 |
37,71 |
42,18 |
19,91 |
2469 |
39,91 |
44,64 |
21,07 |
|
Others |
77,40 |
203,32 |
280,72 |
834 |
10,78 |
4,10 |
2,97 |
553 |
7,14 |
2,72 |
1,97 |
|
HRCA |
227,96 |
227,96 |
0 |
0 |
0 |
0 |
0 |
0 |
0 |
0 |
|
|
Total |
1191,53 |
1342,19 |
2533,72 |
20231 |
16,98 |
15,07 |
7,98 |
21014 |
17,64 |
15,66 |
8,29 |
Tab. 3 Non-investment funding per student between 1991 and 2000 (in thousands CZK)
|
1991 |
1992 |
1993 |
1994 |
1995 |
1996 |
1997 |
1998 |
1999 |
2000 |
|
|
Non-investment subsidies of MoEYS |
296 420 |
312 950 |
425 123 |
518 252 |
637 285 |
728 155 |
751 761 |
851 717 |
879 955 |
924 597 |
|
No. of students |
9 728 |
10 575 |
11 544 |
11 629 |
12 837 |
15 401 |
16 741 |
18 026 |
18 875 |
21 014 |
|
Non-invest./student |
30,47 |
29,59 |
36,83 |
44,53 |
49,64 |
47,28 |
44,91 |
47,25 |
46,62 |
44,00 |
Tab. 4 Total non-investment funding from grants between 1992 and 2000 (in thousands CZK)
|
Faculty |
1992 |
1993 |
1994 |
1995 |
1996 |
1997 |
1998 |
1999 |
2000 |
|
FM |
173 |
3 286 |
6 346 |
6 994 |
12 474 |
13 962 |
13 449 |
21 642 |
27 318 |
|
FA |
0 |
2 196 |
2 034 |
4 660 |
4 786 |
6 794 |
2 290 |
5 946 |
10 176 |
|
FL |
28 |
10 |
0 |
88 |
78 |
207 |
251 |
148 |
458 |
|
SchSS |
3 354 |
5 851 |
13 344 |
||||||
|
FS |
2 187 |
7 743 |
10 733 |
10 437 |
17 067 |
22 507 |
32 649 |
51 297 |
79 343 |
|
FI |
310 |
2 870 |
934 |
523 |
3 656 |
7 875 |
13 591 |
||
|
FE |
2 930 |
1 196 |
2 021 |
900 |
984 |
1 756 |
1 966 |
2 477 |
11 001 |
|
FEA |
386 |
80 |
157 |
1 048 |
1 282 |
1 496 |
1 952 |
1 884 |
2 493 |
|
Others |
7 888 |
15 134 |
24 631 |
15 133 |
4 027 |
8 683 |
3 578 |
5 300 |
|
| of which: | |||||||||
|
RO |
0 |
0 |
0 |
500 |
170 |
316 |
156 |
156 |
386 |
|
ICS |
0 |
0 |
0 |
21 460 |
14 212 |
2 900 |
7 840 |
3 290 |
3 745 |
|
DFL |
0 | 0 | 0 | 0 | 0 | 0 | 0 | 0 |
393 |
|
CFE |
0 |
0 |
0 |
2 671 |
751 |
811 |
687 |
132 |
776 |
|
Total |
5 956 |
22 399 |
36 735 |
51 628 |
52 738 |
51 272 |
68 250 |
100 698 |
163 024 |
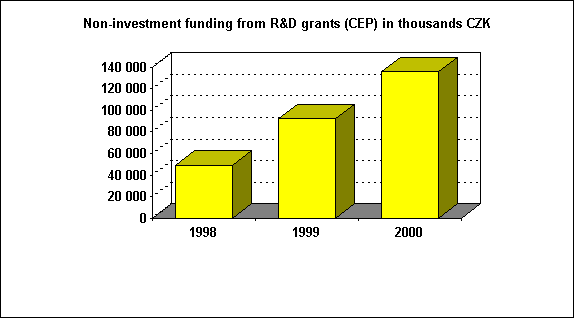
Tab. 4a Non-investment funding from R&D grants (CEP) between 1998 and 2000
|
Faculty |
1998 |
1999 |
2000 |
|
FM |
10 260 |
18 884 |
25 368 |
|
FA |
1 938 |
4 888 |
7 697 |
|
FL |
226 |
138 |
411 |
|
SchSS |
3 225 |
5 710 |
12 324 |
|
FS |
28 687 |
48 462 |
70 056 |
|
FI |
3 531 |
7 608 |
12 541 |
|
FE |
0 |
1 315 |
1 762 |
|
FEA |
629 |
1 812 |
2 168 |
|
Others |
856 |
3 339 |
3 331 |
|
of which: |
|||
|
RO |
156 |
0 |
386 |
|
ICS |
0 |
3 183 |
2 945 |
|
CFE |
700 |
156 |
0 |
|
Total |
49 352 |
92 156 |
135 658 |
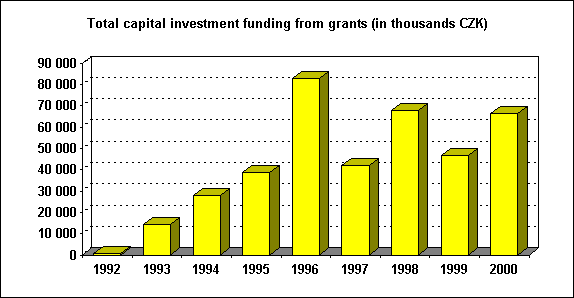
Tab. 5 Total capital investment funds from grants between 1992 and 2000 (in thousands CZK)
|
Faculta |
1992 |
1993 |
1994 |
1995 |
1996 |
1997 |
1998 |
1999 |
2000 |
|
FM |
0 |
1 260 |
2 500 |
9 526 |
3 823 |
1 832 |
2 879 |
6 468 |
6 868 |
|
FA |
0 |
352 |
519 |
1 524 |
1 499 |
1 123 |
1 380 |
2 746 |
4 568 |
|
FL |
0 |
0 |
0 |
75 |
40 |
594 |
55 |
0 |
0 |
|
SchSS |
1 325 |
476 |
724 |
||||||
|
FS |
305 |
2 353 |
5 690 |
5 245 |
45 521 |
19 298 |
21 737 |
24 343 |
46 169 |
|
FI |
40 |
2 170 |
3 140 |
1 689 |
7 923 |
3 095 |
3 135 |
||
|
FE |
187 |
233 |
188 |
221 |
138 |
340 |
610 |
187 |
665 |
|
FEA |
0 |
45 |
157 |
33 |
0 |
0 |
611 |
0 |
0 |
|
Others |
0 |
10 049 |
19 153 |
19 903 |
28 665 |
17 077 |
31 327 |
9 320 |
4 145 |
| of which: | |||||||||
|
RO |
0 |
0 |
0 |
0 |
30 |
0 |
100 |
0 |
0 |
|
ICS |
0 |
0 |
0 |
19 713 |
28 635 |
17 077 |
31 227 |
9 320 |
4 145 |
|
CFE |
0 |
0 |
0 |
190 |
0 |
0 |
0 |
0 |
0 |
|
Total |
492 |
14 292 |
28 090 |
38 697 |
82 826 |
41 953 |
67 847 |
46 635 |
66 274 |
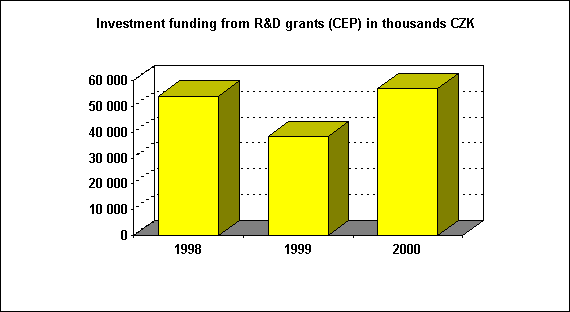
Tab.
5a Capital investment funds
from R&D grants (CEP) between 1998 and 2000
|
Faculty |
1998 |
1999 |
2000 |
|
FM |
390 |
5 753 |
6 423 |
|
FA |
171 |
2 176 |
4 487 |
|
FL |
55 |
0 |
0 |
|
SchSS |
1 265 |
431 |
510 |
|
FS |
13 889 |
19 686 |
42 573 |
|
FI |
7 910 |
2 838 |
2 535 |
|
FE |
87 |
40 |
50 |
|
FEA |
33 |
0 |
0 |
|
Others |
30 196 |
7 393 |
500 |
|
of which: |
|||
|
RO |
0 |
0 |
0 |
|
ICS |
30 196 |
7 393 |
500 |
|
CFE |
0 |
0 |
0 |
|
Total |
53 996 |
38 317 |
57 078 |
Tab. 6 Total payroll funding from grants between 1993 and 1998 (in thousands CZK) ( 1999, 2000 not limited)
|
Faculty |
1993 |
1994 |
1995 |
1996 |
1997 |
1998 |
1999 |
2000 |
|
FM |
82 |
834 |
995 |
1 644 |
3 448 |
3 487 |
5 578 |
7 327 |
|
FA |
88 |
932 |
1 405 |
1 286 |
1 845 |
711 |
1 945 |
2 590 |
|
FL |
0 |
0 |
15 |
41 |
42 |
78 |
43 |
71 |
|
SchSS |
1 419 |
2 949 |
3 909 |
|||||
|
FS |
238 |
1 510 |
2 375 |
3 440 |
5 971 |
8 071 |
17 693 |
21 809 |
|
FI |
0 |
75 |
40 |
106 |
1 186 |
3 681 |
5 089 |
|
|
FE |
655 |
754 |
146 |
184 |
334 |
629 |
714 |
1 146 |
|
FEA |
137 |
12 |
519 |
294 |
415 |
670 |
578 |
625 |
|
Others |
1 810 |
948 |
1 528 |
693 |
504 |
557 |
930 |
923 |
|
of which: |
||||||||
|
RO |
0 |
30 |
0 |
80 |
30 |
30 |
49 |
81 |
|
ICS |
38 |
188 |
275 |
170 |
158 |
879 |
771 |
|
|
CFE |
1 772 |
730 |
1 528 |
338 |
304 |
369 |
2 |
71 |
|
Total |
3 010 |
4 990 |
7 058 |
7 622 |
12 665 |
16 808 |
34 808 |
43 489 |
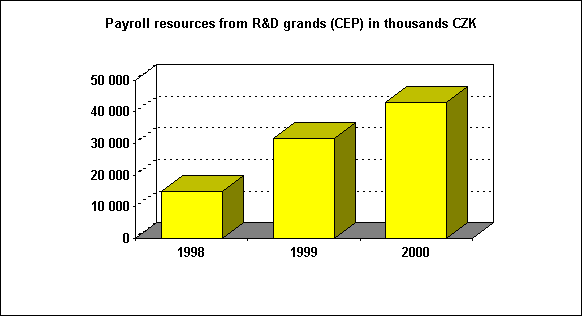
Tab.
6a Payroll
resources from R&D grants (CEP) between 1998 and 2000
|
Faculty |
1998 |
1999 |
2000 |
|
FM |
3 391 |
5 466 |
7 171 |
|
FA |
590 |
1 819 |
2 588 |
|
FL |
0 |
38 |
71 |
|
SchSS |
1 333 |
2 482 |
3 894 |
|
FS |
7 641 |
16 493 |
21 610 |
|
FI |
1 186 |
3 498 |
4 951 |
|
FE |
0 |
504 |
1 113 |
|
FEA |
306 |
543 |
616 |
|
Others |
392 |
775 |
923 |
|
of which: |
|||
|
RO |
42 |
0 |
81 |
|
ICS |
0 |
756 |
771 |
|
CFE |
350 |
19 |
71 |
|
Total |
14 839 |
31 618 |
42 937 |

Tab.
7 Income from extramural
activities between 1991 and 2000 in thousands CZK (HRCA included only
from 1998)
|
Faculty |
1993 |
1994 |
1995 |
1996 |
1997 |
1998 |
1999 |
2000 |
|
FM |
5 610 |
19 816 |
29 949 |
32 617 |
37 071 |
43 351 |
8 863 |
3 979 |
|
FA |
1 804 |
4 003 |
3 293 |
1 946 |
2 422 |
3 890 |
677 |
599 |
|
FL |
9 686 |
19 030 |
14 083 |
20 698 |
18 083 |
20 416 |
3 825 |
3 441 |
|
SchSS |
375 |
231 |
349 |
|||||
|
FS |
7 240 |
8 786 |
9 349 |
9 254 |
9 712 |
14 773 |
17 107 |
15 026 |
|
FI |
691 |
180 |
163 |
448 |
0 |
|||
|
FE |
1 456 |
465 |
860 |
1 376 |
1 185 |
1 190 |
3 315 |
998 |
|
FEA |
1 274 |
2 924 |
3 478 |
2 526 |
3 087 |
3 078 |
5 579 |
4 383 |
|
HRCA |
17 373 |
21 919 |
||||||
|
Others |
5 671 |
11 319 |
24 184 |
31 089 |
27 955 |
29 459 |
24 243 |
20 851 |
|
Total |
32 741 |
66 343 |
85 196 |
100 197 |
99 695 |
116695 |
81 661 |
71 545 |
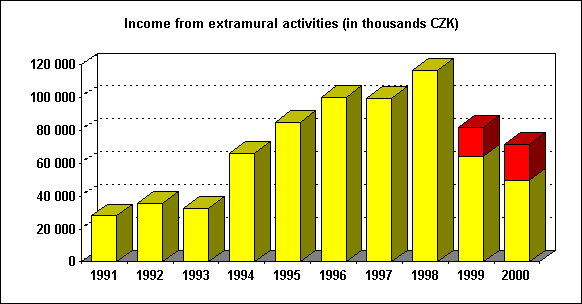
Note:
There
was a change in reporting rules in 1999, and some activities classified
as extramural until 1998 have been reported as non-budgeted incomes of
the core activity since 1999. Calculated according to the now effective
rules, the 1998 income from extramural activities, e.g., would have
totalled 58,944 thousand CZK.
Tab.
8 Total income from grants
per teacher between 1992 and 2000 (in thousands CZK)
|
1992 |
1993 |
1994 |
1995 |
1996 |
1997 |
1998 |
1999 |
2000 |
|
|
Grants |
6 448 |
39 701 |
69 815 |
97 383 |
135 564 |
93 225 |
136 097 |
147 333 |
229 298 |
|
Teachers |
1 049 |
1 079 |
1 107 |
1 089 |
1 135 |
1 145 |
1 151 |
1 195 |
1 192 |
|
Grants / teachers. |
6.15 |
36.79 |
63.07 |
89.42 |
119.44 |
81.42 |
118.26 |
123.29 |
192.36 |
Tab. 9
Income from extramural activities per employee between 1991
and 2000 in thousands CZK
|
1991 |
1992 |
1993 |
1994 |
1995 |
1996 |
1997 |
1998 |
1999 |
2000 |
|
|
Income |
28 070 |
35 583 |
32 741 |
66 343 |
85 196 |
100 197 |
99 695 |
116 695 |
81 661 |
71 545 |
|
No. of employees |
2 182 |
2 232 |
2 309 |
2 309 |
2 275 |
2 435 |
2 448 |
2 477 |
2 497 |
2 536 |
|
Extramural activities / employees |
12.86 |
15.94 |
14.18 |
28.73 |
37.45 |
41.15 |
40.72 |
47.11 |
32.70 |
28.21 |
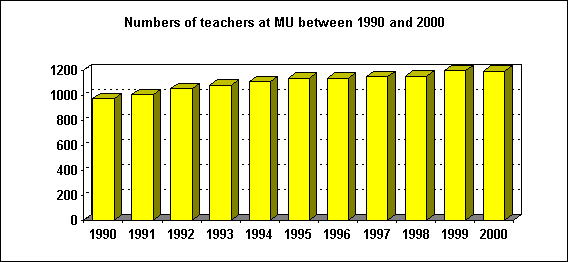
Tab. 10 Number of teachers at MU between 1991 and 2000 )
|
1991 |
1992 |
1993 |
1994 |
1995 |
1996 |
1997 |
1998 |
1999 |
2000 |
|
|
FM |
314.4 |
322.1 |
320.1 |
309.3 |
305.0 |
290.5 |
294.71 |
293.67 |
303.64 |
304.58 |
|
FA |
173.2 |
175.7 |
179.4 |
183.8 |
188.6 |
186.6 |
191.71 |
170.33 |
171.33 |
168.82 |
|
FL |
57.8 |
62.5 |
69.5 |
71.3 |
73.3 |
70.5 |
74.72 |
76.54 |
73.97 |
73.79 |
|
SchSS |
24.32 |
32.69 |
36.77 |
|||||||
|
FS |
200.4 |
211.0 |
208.4 |
202.5 |
195.3 |
200.0 |
195.86 |
196.76 |
211.74 |
203.77 |
|
FI |
6.6 |
20.7 |
24.5 |
28.32 |
28.66 |
43.38 |
48.13 |
|||
|
FE |
193.5 |
197.7 |
205.5 |
225.8 |
232.5 |
233.5 |
226.97 |
219.40 |
214.56 |
216.41 |
|
FEA |
8.6 |
13.2 |
21.2 |
29.9 |
47.2 |
57.0 |
58.29 |
60.38 |
61.94 |
61.86 |
|
O thers |
54.2 |
67.0 |
75.0 |
78.2 |
72.6 |
72.7 |
74.06 |
80.75 |
82.04 |
77.40 |
|
Total |
1 002.1 |
1 049.2 |
1 079.1 |
1 107.4 |
1135.2 |
1135.3 |
1144.64 |
1150.81 |
1195.29 |
1191.53 |
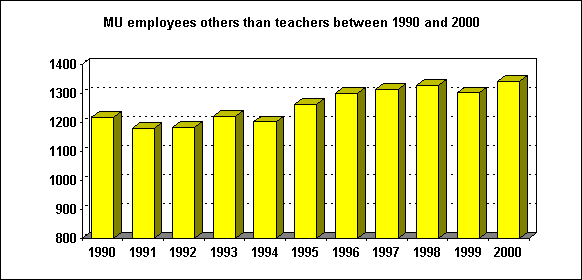
Tab. 11 MU employees others than teachers between 1990 and 1999
|
Faculty |
1991 |
1992 |
1993 |
1994 |
1995 |
1996 |
1997 |
1998 |
1999 |
2000 |
|
FM |
277.4 |
268.5 |
271.1 |
267.0 |
269.6 |
269.0 |
269.82 |
238.75 |
221.72 |
221.58 |
|
FA |
88.5 |
88.5 |
93.7 |
93.2 |
88.1 |
92.9 |
96.34 |
86.00 |
84.20 |
83.53 |
|
FL |
57.2 |
54.0 |
66.9 |
65.3 |
80.5 |
72.9 |
69.13 |
66.84 |
64.51 |
61.49 |
|
SchSS |
21.31 |
21.87 |
32.45 |
|||||||
|
FS |
223.7 |
226.9 |
234.5 |
232.8 |
245.3 |
247.8 |
264.51 |
277.92 |
276.68 |
294.52 |
|
FI |
19.7 |
36.1 |
40.99 |
53.95 |
48.24 |
48.99 |
||||
|
FE |
105.9 |
102.1 |
101.1 |
103.3 |
112.9 |
117.3 |
116.71 |
112.03 |
112.16 |
113.04 |
|
FEA |
29.6 |
26.5 |
27.4 |
29.7 |
40.5 |
45.5 |
39.17 |
47.40 |
55.57 |
55.31 |
|
O thers |
179.9 |
196.3 |
196.4 |
180.5 |
187.7 |
189.5 |
192.96 |
187.25 |
194.44 |
203.32 |
|
HRCA |
217.7 |
220.0 |
230.6 |
226.2 |
217.8 |
228.3 |
224.19 |
235.05 |
222.27 |
227.96 |
|
Total |
1 179.9 |
1 182.8 |
1 219.7 |
1 202.0 |
1262.1 |
1 299.3 |
1313.82 |
1326.50 |
1301.66 |
1 342.19 |
Tab.
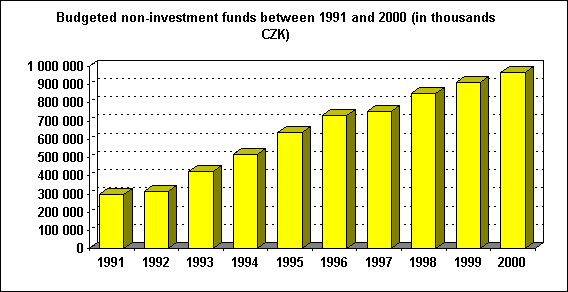
12 Budgeted non-investment
funds between 1991 and 2000 (in thousands CZK)
|
1991 |
1992 |
1993 |
1994 |
1995 |
1996 |
1997 |
1998 |
1999 |
2000 |
|
296 420 |
312 950 |
425 123 |
518 252 |
637 285 |
728 155 |
751 761 |
851 717 |
909 626 |
966 977 |
Tab.
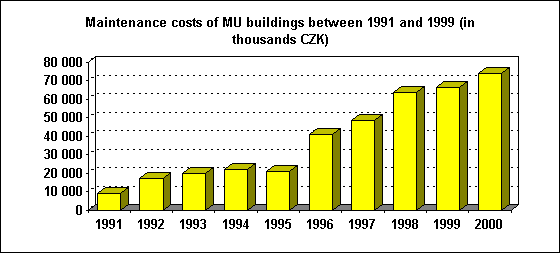
13 Maintenance costs of MU
buildings between 1991 and 1999 in thousands CZK
|
Year |
1991 |
1992 |
1993 |
1994 |
1995 |
1996 |
1997 |
1998 |
1999 |
2000 |
|
Amount |
9 451 |
17 061 |
19 738 |
22 155 |
21 192 |
41 023 |
48 685 |
63 833 |
66 458 |
73 833 |
Tab.
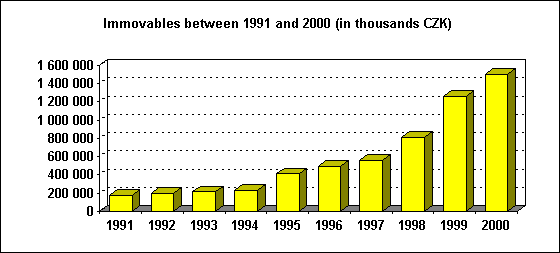
14 Immovables between 1991
and 2000 (in thousands CZK)
|
1991 |
1992 |
1993 |
1994 |
1995 |
1996 |
1997 |
1998 |
1999 |
2000 |
|
172 768 |
198 978 |
214 478 |
232 465 |
410 972 |
490 902 |
556 326 |
811 241 |
1 260 731 |
1 498 516 |
Tab.
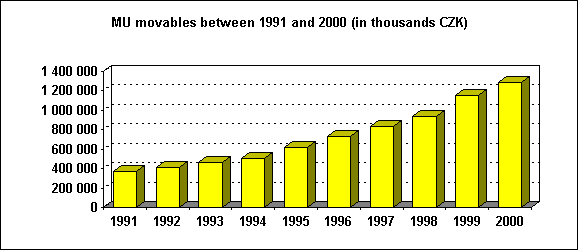
15 MU movables between 1991
and 2000 (in thousands CZK)
|
1991 |
1992 |
1993 |
1994 |
1995 |
1996 |
1997 |
1998 |
1999 |
2000 |
|
372 787 |
418 367 |
461 685 |
506 541 |
614 659 |
728 618 |
828 203 |
938 231 |
1 154 398 |
1 280 592 |
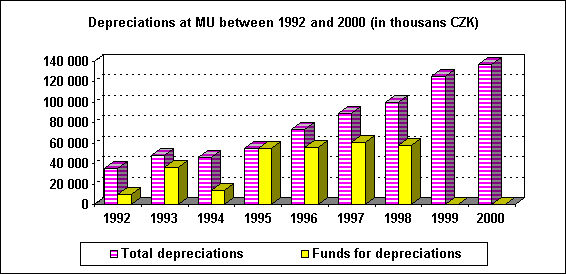
Tab. 16 Depreciations at MU between 1992 and 2000 (in thousands CZK)
|
1992 |
1993 |
1994 |
1995 |
1996 |
1997 |
1998 |
1999 |
2000 |
|
|
Total depreciation |
35 220 |
47 605 |
46 025 |
54 675 |
73 598 |
89 169 |
100 144 |
125 535 |
136 815 |
|
Funds for depreciation |
10 000 |
36 355 |
13 588 |
54 435 |
55 397 |
60 801 |
57 544 |
0 |
0 |
