Ing. František Gale, Bursar
The graphic and tabular parts of this chapter will undergo changes next year brought on by the necessity of dealing with topical problems. We regard it as useful to preserve a necessary level of comparison, and at the same time maintain the continuity that documents trends in the economic behaviour of the university. For that reason, we will shift the tracking progression in 2002. The baseline for the following period will be the year 1995, which was in many ways the key year in the past decade.
The year 1995 marked the end of financing public schools of higher education in the Czech Republic, and thus also of Masaryk University, characterized by annual increments in appropriations to schools' activities. In 1995, MU enjoyed the highest ratio of non-investment resources per student (49.64 CZK / student). The year 1995 was the last time that subsidies for fixed assets depreciation were allocated in full value. Since 1996, the indicators monitored have been subject to marked fluctuations. This development was the consequence of a long-term search for proportions and method in financing of public schools of higher education by the Ministry after the application of the government’s economic "packages".
The results of these developments between 1996 and 2000 inclusive, were a number of necessary, often unpopular measures that the University was forced to take, especially in 1999 and 2000, in order to cope with the situation.
The economic results for 2001 clearly show that the measures taken by the University centre were correct, and effective in their consequences.
To achieve changes in the economic behaviour of an organization that is today the third largest institution of higher learning in the CR, and the largest university in Brno, is not a short-term matter, and many measures taken begin to have an impact only after a considerable delay.
Even so, several indicators contained in the annual report for 2000 showed change for the better.
The year 2001 which we are now evaluating showed that the University had once again become stabilised, economically as well as in its professional, organizational and technical aspects. This finding is especially significant in the phase of the final development activities of MU (construction of a new campus) that were begun in 2001. The progress of the indicators is clear from the tables and graphs in the later part of this chapter.
I will therefore make only a brief commentary emphasising key numbers and comparisons.
The most important evidence of economic success in the past year is a positive final balance of 38,449,000 CZK generated from all the types of activity that this University carries out and provides.
Compared to 2000, when the University suffered a loss of 2.236 million CZK, it is a noteworthy result.
The most valuable finding was that a positive balance was achieved by all of the faculties and other monitored institutions of the MU. This is a fact that qualitatively changed the situation of our school, in comparison with commentaries from previous years.
If we count 15 million CZK in revenue from the sale of the medical forensics building, the final balance before taxes comes to 53.449 million CZK. It must be stated, however, that the University will actually receive the 15 million at the end of a payment calendar agreed on with the purchasing organization, St. Anne’s Hospital.
The final balance for 2001 was influenced in a significant manner by the revenue of the MU Rector's Office of 18 million CZK, and is the result of effective work with the assets of MU, and cooperation with the financing bank, Komerční banka Brno.
The second result worth emphasizing is the financial performance of the Hall of residences and Cafeterias Administration of 1.4 million CZK in gross revenues. In view of the problems in administering residence halls and cafeterias at MU, which were also called upon to finance some problematic operations (such as the Cikháj education centre), the result achieved is a good foundation for 2002, when several qualitative changes (expansion of the Internet in residence halls, expansion of the credit system, and changes in technologies in preparation of meals) are planned.
An equally important financial result is in the management of the faculties. Fundamental changes were achieved even at those faculties that in past years were economically questionable (Faculty of Medicine, Faculty of Education, Faculty of Arts). The gross revenues generated by the faculties will make it possible in 2002 to address long-term conceptual tasks involved in the construction of a university campus, e.g. the creation of financial reserves for fixed assets necessary to finance the Program for Development of the Technical and Facilities Infrastructure of Masaryk University.
In the future, lower expenditures on maintenance of fixed assets will be a goal of the management of Masaryk University.
Finally, it is necessary to appreciate the financial result of the Centre for Further Education; although not a large department by MU standards, it has consistently produced noteworthy achievements. In view of its focus on lifelong education, the financial results from 2001 at this department argue in favour of further developing the centre at MU.
A number of factors had a positive influence on the 2001 results. One basic factor was the overall policy of the university vis-à-vis the Ministry, under which general and special purpose funds were obtained markedly exceeding those of 2000.
In 2001, the subsidies for teaching activities were 666,108,000 CZK; subsidies for non-specific research were 93,417,000 CZK, and subsidies for operation of residence halls and cafeterias were 52,223,000 CZK.
However, basic subsidies of a non-investment character do not account for the entire volume of MU revenues.
Thanks to the activities of MU in the area of grants, operations in its core and extramural activities, and the activities of the faculties in obtaining special purpose non-normative subsidies from the Ministry of Education, the overall revenues of MU totalled 1.405 billion CZK.
The following is a comparison between overall MU revenues and normative subsidies in 2001:
| normative subsidies | 0.807 billion CZK | 57.4% |
| other revenues | 0.598 billion CZK | 42.6% |
| Total revenues | 1.405 billion CZK | 100 % |
An independent chapter in the 2001 fiscal year evaluation is the area of investments, which for Masaryk University consists of investment in construction, acquisition of machines, equipment, and instruments, the development of HW and SW, including computer networks; and last but not least reconstruction and modernization of the University’s existing property.
In 2001, two structures were completed the nature of which places them to the peak phase of development of this University's infrastructure planned for the period 2001-2006.
In September 2001, Part I of the Morphological Centre - Institute of Anatomy at MU Faculty of Medicine at Kamenice 3 – Bohunice, was inaugurated for use, with a total value of 136 million CZK.
This key facility of the FoM, with equipment of the highest European standard, lays the foundation for the future transfer of the Faculty to the vicinity of the Teaching Hospital in Bohunice.
Besides the Teaching Hospital in Bohunice, the Institute of Anatomy and Pathology was built, and opened for operation in mid-2001. The construction work was the responsibility of the Teaching Hospital in Bohunice, MU installed of top-level technology valued at nearly 6 million CZK.
A third facility put into operation in 2001 in the MU area in Bohunice was the Institute of Ecotoxicology of the MU Faculty of Science. This facility finally brings into reality the vision of the University management and both faculties, i.e. the joining of specialized FoM and FoS institutes.
Another important construction project of 2001 with a value of 86.6 million CZK was the new faculty library at Arne Nováka 1, to mainly serve the needs of the Faculty of Arts and also those of the School of Social Studies.
Among several smaller building projects, I will mention only three that characterize the standard practice at the university: to constantly improve the conditions at individual facilities even while continuing to build.
First among them was the complete reconstruction and modernization of the main building of the Centre for Further Education in Šlapanice worth 21.5 million CZK. At that locality, accessible by trolleybus from Brno, University has its lifelong education facility, which meets even the EU strict requirements after reconstruction. All that remains for total satisfaction is to finalize the reconstruction of the accommodation facility.
Another important project was the first part of the reconstruction of the MU Centre in the Kounicův Palace, at a cost of 8.2 million CZK, where it was necessary to address the problems of plumbing, service elevators, and more energy-efficient windows. With the financing provided for, the 2nd part is planned for 2002.
The third high priority project, whose importance goes beyond the MU community, is investment into the modernization of the computer network, and bringing the Internet into the residence halls. The fibre optic cables alone cost 11.1 million CZK.
To the above examples, a host of smaller activities could be added carried out by the faculties, the Institute of Computer Technology, and the specialized departments at the MU Rector’s Office, and which bring the overall resources invested into building to the total of 218.4 million CZK in 2001.
Besides construction activities, the university received, after a long period, a special purpose subsidy for machines and equipment worth about 22 million CZK.
That subsidies and special purpose investment grants were used to purchase a significant amount of top technology and instruments, including computer technology, by the faculties and institutions of Masaryk University in the last year, which partially erased the debt of years past, when most of the investment from financial resources and grants went for construction and physical infrastructure.
In the evaluation for 2001, attention must be paid to the foremost development initiative, i.e. the preparations for the construction on the Bohunice campus.
In addition to the preliminary projects described above, the year 2001 was a year of extensive and difficult work on preparing the documentation for acquiring financial resources and government guarantees for the realization of our program of development.
To obtain support for a project costing more than 4 billion crowns from the Ministry of Education, Ministry of Finance, the government, the political parties, and the appropriation and education committees of the Parliament, as well as from the leadership of other Czech institutes of higher learning and the City of Brno, has not been an easy task.
Achievements:
The Program for the Development of the Material-Technical Base of Masaryk University in Brno was prepared and given the number 333 330. The program was divided into two subprograms:
At the end of the year, the comprehensive material, after complicated clarification of legislative, organizational, financial, and technical problems,
was prepared for discussion at the levels of the ministries, the government and the Parliament of the CR. We expect that 2002 will be a year of extensive preparatory work on the project, and of the launching of the project's realization.
The year 2001 at MU was, however, very rich in other areas as well, suffice to mention the results achieved in science and research, and development programs of the faculties and research centres. Developments are most accurately illustrated in the graphs and tables in the second part of this section. Looking back at 2001, it can be said with satisfaction that the conclusions drawn from the financial analysis for 2000 and the goals outlined in the last year's annual report were not only fulfilled, but in many cases exceeded. The task for 2002 will be to maintain that trend.
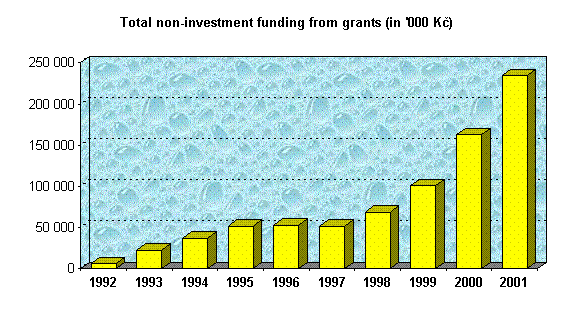
Tab. 1 – Students-to-employees ratios at MU between 1991 and 2001
|
|
1991 |
1992 |
1993 |
1994 |
1995 |
1996 |
1997 |
1998 |
1999 |
2000 |
2001 |
|
Number of students |
9 728 |
10 575 |
11 544 |
11 629 |
12 837 |
15 401 |
16 741 |
18 026 |
18 785 |
21 014 |
23 543 |
|
No. of employees |
2 182 |
2 232 |
2 309 |
2 309 |
2 275 |
2 435 |
2 458 |
2 477 |
2 497 |
2 534 |
2 482 |
|
Students/employees |
4.46 |
4.74 |
5.00 |
5.04 |
5.64 |
6.32 |
6.81 |
7.28 |
7.52 |
8.29 |
9.49 |
Tab. 2 – Numbers of personnel and students in 2001
|
|
Personnel |
Degree students |
All students |
||||||||
|
Faculties |
teachers |
others |
total |
number |
stud.'s / |
stud.'s / |
stud.'s / |
number |
stud.'s / |
stud.'s / |
stud.'s / |
|
|
|
|
|
|
teachers |
others |
total |
|
teachers |
others |
total |
|
FoM. |
283.3 |
211.6 |
494.9 |
2 359 |
8.32 |
11.15 |
4.77 |
2 380 |
8.40 |
11.25 |
4.81 |
|
FoA |
166.9 |
79.6 |
246.5 |
3 781 |
22.65 |
47.50 |
15.34 |
4 031 |
24.15 |
50.64 |
16.35 |
|
FoL |
71.2 |
56.4 |
127.6 |
2 569 |
36.08 |
45.55 |
20.13 |
2 624 |
36.85 |
46.52 |
20.56 |
|
SoSS |
38.9 |
43.3 |
82.2 |
1 720 |
44.22 |
39.72 |
20.92 |
1 791 |
46.04 |
41.36 |
21.79 |
|
FoS. |
211.4 |
295.8 |
507.2 |
2 585 |
12.23 |
8.74 |
5.10 |
2 585 |
12.23 |
8.74 |
5.10 |
|
FoI |
39.4 |
50.8 |
90.2 |
1 561 |
39.82 |
30.73 |
17.34 |
1 566 |
39.95 |
30.83 |
17.40 |
|
FoE |
209.7 |
92.6 |
302.3 |
4 039 |
19.27 |
43.62 |
13.37 |
4 918 |
23.64 |
53.11 |
16.27 |
|
FoEA |
63.4 |
58.1 |
121.5 |
2 562 |
40.35 |
44.10 |
21.07 |
2 969 |
46.76 |
51.10 |
24.42 |
|
Other |
76.1 |
202.8 |
278.9 |
0 |
0 |
0 |
0 |
679 |
8.90 |
2.43 |
2.43 |
|
HRCA |
0 |
230.3 |
230.3 |
0 |
0 |
0 |
0 |
0 |
0 |
0 |
0 |
|
Total |
1 160.3 |
1 321.3 |
2 481.6 |
21 176 |
18.25 |
16.03 |
8.53 |
23 543 |
20.29 |
17.82 |
9.49 |
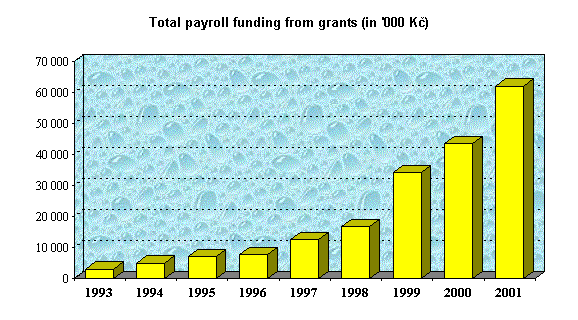
Tab. 3 – Non-investment funding per student between 1991 and 2001 (in '000 CZK)
|
|
1991 |
1992 |
1993 |
1994 |
1995 |
1996 |
1997 |
1998 |
1999 |
2000 |
2001 |
|
Non-investment funds from the MoE |
296 420 |
312 950 |
425 123 |
518 252 |
637 285 |
728 155 |
751 761 |
851 717 |
879 955 |
924 597 |
1 127 938 |
|
Number of students |
9 728 |
10 575 |
11 544 |
11 629 |
12 837 |
15 401 |
16 741 |
18 026 |
18 875 |
21 014 |
23 543 |
|
Noniv. funds / student |
30.47 |
29.59 |
36.83 |
44.53 |
49.64 |
47.28 |
44.91 |
47.25 |
46.62 |
44.00 |
47.91 |
Tab. 4 – Total non-investment funding from grants, 1992 – 2001, in '000 CZK
|
Faculty |
1992 |
1993 |
1994 |
1995 |
1996 |
1997 |
1998 |
1999 |
2000 |
2001 |
|
FoM |
173 |
3 286 |
6 346 |
6 994 |
12 474 |
13 962 |
13 449 |
21 642 |
27 318 |
43 237 |
|
FoA |
0 |
2 196 |
2 034 |
4 660 |
4 786 |
6 794 |
2 290 |
5 946 |
10 176 |
22 855 |
|
FoL |
28 |
10 |
0 |
88 |
78 |
207 |
251 |
148 |
458 |
1 098 |
|
SoSS |
|
|
|
|
|
|
3 354 |
5 851 |
13 344 |
19 788 |
|
FoS |
2 187 |
7 743 |
10 733 |
10 437 |
17 067 |
22 507 |
32 649 |
51 297 |
79 343 |
97 433 |
|
FoI |
|
|
310 |
2 870 |
934 |
523 |
3 656 |
7 875 |
13 591 |
16 134 |
|
FoE |
2 930 |
1 196 |
2 021 |
900 |
984 |
1 756 |
1 966 |
2 477 |
11 001 |
22 176 |
|
FoEA |
386 |
80 |
157 |
1 048 |
1 282 |
1 496 |
1 952 |
1 884 |
2 493 |
4 292 |
|
Others |
|
7 888 |
15 134 |
24 631 |
15 133 |
4 027 |
8 683 |
3 578 |
5 300 |
7 209 |
|
|
of which: |
|
|
|
|
|
|
|
|
|
|
RO MU |
0 |
0 |
0 |
500 |
170 |
316 |
156 |
156 |
386 |
3 128 |
|
ICS |
0 |
0 |
0 |
21 460 |
14 212 |
2 900 |
7 840 |
3 290 |
3 745 |
3 337 |
|
DFL |
|
|
|
|
|
|
|
|
393 |
0 |
|
CFE |
0 |
0 |
0 |
2 671 |
751 |
811 |
687 |
132 |
776 |
744 |
|
Total |
5 956 |
22 399 |
36 735 |
51 628 |
52 738 |
51 272 |
68 250 |
100 698 |
163 024 |
234 222 |
Tab. 4a – Non-investment funding from R&D grants (CEP), 1998 - 2001
|
Faculty |
1998 |
1999 |
2000 |
2001 |
|
FoM |
10 260 |
18 884 |
25 368 |
39 168 |
|
FoA |
1 938 |
4 888 |
7 697 |
13 978 |
|
FoL |
226 |
138 |
411 |
765 |
|
SoSS |
3 225 |
5 710 |
12 324 |
19 511 |
|
FoS |
28 687 |
48 462 |
70 056 |
84 846 |
|
FoI |
3 531 |
7 608 |
12 541 |
13 506 |
|
FoE |
0 |
1 315 |
1 762 |
2 400 |
|
FoEA |
629 |
1 812 |
2 168 |
2 584 |
|
Others |
856 |
3 339 |
3 331 |
2 752 |
|
|
of which: |
|
|
|
|
RO MU |
156 |
0 |
386 |
411 |
|
ICS |
0 |
3 183 |
2 945 |
2 341 |
|
DFL |
700 |
156 |
0 |
0 |
|
Total |
49 352 |
92 156 |
135 658 |
179 510 |
Tab. 5 – Total capital investment funds from grants, 1992 – 2001, in '000 CZK.
|
Faculty |
1992 |
1993 |
1994 |
1995 |
1996 |
1997 |
1998 |
1999 |
2000 |
2001 |
|
FoM |
0 |
1 260 |
2 500 |
9 526 |
3 823 |
1 832 |
2 879 |
6 468 |
6 868 |
7 715 |
|
FoA |
0 |
352 |
519 |
1 524 |
1 499 |
1 123 |
1 380 |
2 746 |
4 568 |
1 889 |
|
FoL |
0 |
0 |
0 |
75 |
40 |
594 |
55 |
0 |
0 |
0 |
|
SoSS |
|
|
|
|
|
|
1 325 |
476 |
724 |
1 049 |
|
FoS |
305 |
2 353 |
5 690 |
5 245 |
45 521 |
19 298 |
21 737 |
24 343 |
46 169 |
52 334 |
|
FoI |
|
|
40 |
2 170 |
3 140 |
1 689 |
7 923 |
3 095 |
3 135 |
3 798 |
|
FoE |
187 |
233 |
188 |
221 |
138 |
340 |
610 |
187 |
665 |
486 |
|
FoEA |
0 |
45 |
157 |
33 |
0 |
0 |
611 |
0 |
0 |
1 106 |
|
Others |
0 |
10 049 |
19 153 |
19 903 |
28 665 |
17 077 |
31 327 |
9 320 |
4 145 |
968 |
|
|
of which: |
|
|
|
|
|
|
|
|
|
|
RO MU |
0 |
0 |
0 |
0 |
30 |
0 |
100 |
0 |
0 |
0 |
|
ICS |
0 |
0 |
0 |
19 713 |
28 635 |
17 077 |
31 227 |
9 320 |
4 145 |
968 |
|
DFL |
0 |
0 |
0 |
190 |
0 |
0 |
0 |
0 |
0 |
0 |
|
Total |
492 |
14 292 |
28 090 |
38 697 |
82 826 |
41 953 |
67 847 |
46 635 |
66 274 |
69 345 |
Tab. 5a – Capital investment funds from R&D grants (CEP), 1998 – 2001
|
Faculty |
1998 |
1999 |
2000 |
2001 |
|
FoM |
390 |
5 753 |
6 423 |
4 936 |
|
FoA |
171 |
2 176 |
4 487 |
1 555 |
|
FoL |
55 |
0 |
0 |
0 |
|
SoSS |
1 265 |
431 |
510 |
1 049 |
|
FoS |
13 889 |
19 686 |
42 573 |
50 036 |
|
FoI |
7 910 |
2 838 |
2 535 |
2 538 |
|
FoE |
87 |
40 |
50 |
41 |
|
FoEA |
33 |
0 |
0 |
0 |
|
Others |
30 196 |
7 393 |
500 |
314 |
|
of which: |
|
|
|
|
|
RO MU |
0 |
0 |
0 |
0 |
|
ICS |
30 196 |
7 393 |
500 |
314 |
|
DFL |
0 |
0 |
0 |
0 |
|
Total |
53 996 |
38 317 |
57 078 |
60 469 |

Tab. 6 – Total payroll funding from grants between 1993 and 2001 (in '000 CZK)
(1999, 2000, 2001 – not limited)
|
Faculty |
1993 |
1994 |
1995 |
1996 |
1997 |
1998 |
1999 |
2000 |
2001 |
|
FoM |
82 |
834 |
995 |
1 644 |
3 448 |
3 487 |
5 578 |
7 327 |
8 949 |
|
FoA |
88 |
932 |
1 405 |
1 286 |
1 845 |
711 |
1 945 |
2 590 |
6 544 |
|
FoL |
0 |
0 |
15 |
41 |
42 |
78 |
43 |
71 |
194 |
|
SoSS |
|
|
|
|
|
1 419 |
2 949 |
3 909 |
5 077 |
|
FoS |
238 |
1 510 |
2 375 |
3 440 |
5 971 |
8 071 |
17 693 |
21 809 |
28 026 |
|
FoI |
|
0 |
75 |
40 |
106 |
1 186 |
3 681 |
5 089 |
5 219 |
|
FoE |
655 |
754 |
146 |
184 |
334 |
629 |
714 |
1 146 |
3 531 |
|
FoEA |
137 |
12 |
519 |
294 |
415 |
670 |
578 |
625 |
1 871 |
|
Others |
1 810 |
948 |
1 528 |
693 |
504 |
557 |
930 |
923 |
2 704 |
|
of which: |
|
|
|
|
|
|
|
|
|
|
RO MU |
0 |
30 |
0 |
80 |
30 |
30 |
49 |
81 |
1 041 |
|
ICS |
38 |
188 |
|
275 |
170 |
158 |
879 |
771 |
1 466 |
|
DFL |
1 772 |
730 |
1 528 |
338 |
304 |
369 |
2 |
71 |
197 |
|
Total |
3 010 |
4 990 |
7 058 |
7 622 |
12 665 |
16 808 |
34 808 |
43 489 |
62 115 |
Tab. 6a – Payroll resources from R&D grants (CEP), 1998 – 2001
|
Faculty |
1998 |
1999 |
2000 |
2001 |
|
FoM |
3 391 |
5 466 |
7 171 |
7 432 |
|
FoA |
590 |
1 819 |
2 588 |
3 274 |
|
FoL |
0 |
38 |
71 |
127 |
|
SoSS |
1 333 |
2 482 |
3 894 |
5 023 |
|
FoS |
7 641 |
16 493 |
21 610 |
24 080 |
|
FoI |
1 186 |
3 498 |
4 951 |
4 239 |
|
FoE |
0 |
504 |
1 113 |
639 |
|
FoEA |
306 |
543 |
616 |
827 |
|
Others |
392 |
775 |
923 |
1 036 |
|
of which: |
|
|
|
|
|
RO MU |
42 |
0 |
81 |
112 |
|
ICS |
0 |
756 |
771 |
924 |
|
DFL |
350 |
19 |
71 |
0 |
|
Total |
14 839 |
31 618 |
42 937 |
46 677 |
Tab. 7 – Revenues from extramural activities, 1991 – 2001, in '000 CZK (until 1998 w/o HRCA)
|
Faculty |
1993 |
1994 |
1995 |
1996 |
1997 |
1998 |
1999 |
2000 |
2001 |
|
FoM |
5 610 |
19 816 |
29 949 |
32 617 |
37 071 |
43 351 |
8 863 |
3 979 |
3 451 |
|
FoA |
1 804 |
4 003 |
3 293 |
1 946 |
2 422 |
3 890 |
677 |
599 |
991 |
|
FoL |
9 686 |
19 030 |
14 083 |
20 698 |
18 083 |
20 416 |
3 825 |
3 441 |
3 910 |
|
SoSS |
|
|
|
|
|
375 |
231 |
349 |
152 |
|
FoS |
7 240 |
8 786 |
9 349 |
9 254 |
9 712 |
14 773 |
17 107 |
15 026 |
17 049 |
|
FoI |
|
|
|
691 |
180 |
163 |
448 |
0 |
0 |
|
FoE |
1 456 |
465 |
860 |
1 376 |
1 185 |
1 190 |
3 315 |
998 |
705 |
|
FoEA |
1 274 |
2 924 |
3 478 |
2 526 |
3 087 |
3 078 |
5 579 |
4 383 |
3 393 |
|
HRCA |
|
|
|
|
|
|
17 373 |
21 919 |
25 330 |
|
Others |
5 671 |
11 319 |
24 184 |
31 089 |
27 955 |
29 459 |
24 243 |
20 851 |
15 128 |
|
Totals |
32 741 |
66 343 |
85 196 |
100 197 |
99 695 |
116 695 |
81 661 |
71 545 |
70 109 |
Note:
Reporting rules were changed in 1999, whereby some activities classified as extramural through 1998 have been reported since 1999 as non-budgeted revenues from core activities. According to the current reporting rules, extramural activities in 1998 would, e.g. total 58,944 thousand CZK.
Tab. 8 – Funds from special-purpose grants per teacher
(1992 – 2001 in '000 CZK)
|
|
1992 |
1993 |
1994 |
1995 |
1996 |
1997 |
1998 |
1999 |
2000 |
2001 |
|
Grant funds |
6 448 |
39 701 |
69 815 |
97 383 |
135 564 |
93 225 |
136 097 |
147 333 |
229 298 |
303 567 |
|
No. of teachers |
1 049 |
1 079 |
1 107 |
1 089 |
1 135 |
1 145 |
1 151 |
1 195 |
1 192 |
1 160 |
|
Funds/teacher |
6.15 |
36.79 |
63.07 |
89.42 |
119.44 |
81.42 |
118.26 |
123.29 |
192.36 |
261.70 |
Tab. 9 – Revenues from extramural activities per employee between 1991 and 2001 (in '000 CZK)
|
|
1991 |
1992 |
1993 |
1994 |
1995 |
1996 |
1997 |
1998 |
1999 |
2000 |
2001 |
|
extramural activities revenues |
28 070 |
35 583 |
32 741 |
66 343 |
85 196 |
100 197 |
99 695 |
116 695 |
81 661 |
71 545 |
70 109 |
|
employees |
2 182 |
2 232 |
2 309 |
2 309 |
2 275 |
2 435 |
2 458 |
2 477 |
2 497 |
2 534 |
2 482 |
|
revenues / employee |
12,86 |
15,94 |
14,18 |
28,73 |
37,45 |
41,15 |
40,56 |
47,11 |
32,70 |
28,23 |
28,25 |
Tab. 10 – Employment at MU, 1991 – 2001, academic staff
| Faculty | 1991 | 1992 | 1993 | 1994 | 1995 | 1996 | 1997 | 1998 | 1999 | 2000 | 2001 |
|
FoM |
314.4 |
322.1 |
320.1 |
309.3 |
305.0 |
290.5 |
294.7 |
293.7 |
303.6 |
304.6 |
283.3 |
|
FoA |
173.2 |
175.7 |
179.4 |
183.8 |
188.6 |
186.6 |
191.7 |
170.3 |
171.3 |
168.8 |
166.9 |
|
FoL |
57.8 |
62.5 |
69.5 |
71.3 |
73.3 |
70.5 |
74.7 |
76.5 |
74.0 |
73.8 |
71.2 |
|
SoSS |
|
|
|
|
|
|
|
24.3 |
32.7 |
36.8 |
38.9 |
|
FoS |
200.4 |
211.0 |
208.4 |
202.5 |
195.3 |
200.0 |
195.9 |
196.8 |
211.7 |
203.8 |
211.4 |
|
FoI |
|
|
|
6.6 |
20.7 |
24.5 |
28.3 |
28.7 |
43.4 |
48.1 |
39.4 |
|
FoE |
193.5 |
197.7 |
205.5 |
225.8 |
232.5 |
233.5 |
227.0 |
219.4 |
214.6 |
216.4 |
209.7 |
|
FoEA |
8.6 |
13.2 |
21.2 |
29.9 |
47.2 |
57.0 |
58.3 |
60.4 |
61.9 |
61.9 |
63.4 |
|
Others |
54.2 |
67.0 |
75.0 |
78.2 |
72.6 |
72.7 |
74.1 |
80.8 |
82.0 |
77.4 |
76.1 |
|
Total |
1 002.1 |
1 049.2 |
1 079.1 |
1 107.4 |
1 135.2 |
1 135.3 |
1 144.7 |
1 150.9 |
1 195.2 |
1 191.6 |
1 160.3 |
Tab. 11 – Employment at MU, 1990 – 2001 (non-academic employees )
|
Faculty |
1991 |
1992 |
1993 |
1994 |
1995 |
1996 |
1997 |
1998 |
1999 |
2000 |
2001 |
|
FoM |
277.4 |
268.5 |
271.1 |
267.0 |
269.6 |
269.0 |
269.8 |
238.8 |
221.7 |
221.6 |
211.6 |
|
FoA |
88.5 |
88.5 |
93.7 |
93.2 |
88.1 |
92.9 |
96.3 |
86.0 |
84.2 |
83.5 |
79.6 |
|
FoL |
57.2 |
54.0 |
66.9 |
65.3 |
80.5 |
72.9 |
69.1 |
66.8 |
64.5 |
61.5 |
56.4 |
|
SoSS |
|
|
|
|
|
|
|
21.3 |
21.9 |
32.5 |
43.3 |
|
FoS |
223.7 |
226.9 |
234.5 |
232.8 |
245.3 |
247.8 |
264.5 |
277.9 |
276.7 |
294.5 |
295.8 |
|
FoI |
|
|
|
|
19.7 |
36.1 |
41.0 |
54.0 |
48.2 |
49.0 |
50.8 |
|
FoE |
105.9 |
102.1 |
101.1 |
103.3 |
112.9 |
117.3 |
116.7 |
112.0 |
112.2 |
113.0 |
92.6 |
|
FoEA |
29.6 |
26.5 |
27.4 |
29.7 |
40.5 |
45.5 |
39.2 |
47.4 |
55.6 |
55.3 |
58.1 |
|
Others |
179.9 |
196.3 |
196.4 |
180.5 |
187.7 |
189.5 |
193.0 |
187.3 |
194.4 |
203.3 |
202.8 |
|
HRCA |
217.7 |
220.0 |
230.6 |
226.2 |
217.8 |
228.3 |
224.2 |
235.1 |
222.3 |
228.0 |
230.3 |
|
Total |
1 179.9 |
1 182.8 |
1 219.7 |
1 202.0 |
1 262.1 |
1 299.3 |
1 313.8 |
1 326.6 |
1 301.7 |
1 342.2 |
1 321.3 |
Tab. 12 – Budgeted non-investment funds between 1991 and 2001 (in '000 CZK)
|
1991 |
1992 |
1993 |
1994 |
1995 |
1996 |
1997 |
1998 |
1999 |
2000 |
2001 |
|
296 420 |
312 950 |
425 123 |
518 252 |
637 285 |
728 155 |
751 761 |
851 717 |
909 626 |
966 978 |
1 178 674 |

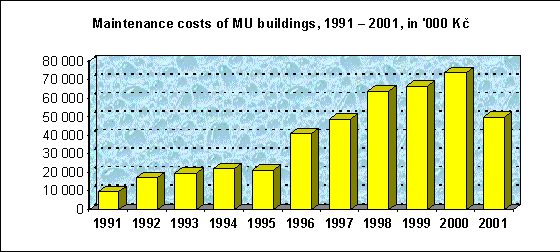
Tab. 13 – Maintenance costs of MU buildings, 1991 – 2001, in '000 CZK
|
Year |
1991 |
1992 |
1993 |
1994 |
1995 |
1996 |
1997 |
1998 |
1999 |
2000 |
2001 |
|
Costs |
9 451 |
17 061 |
19 738 |
22 155 |
21 192 |
41 023 |
48 685 |
63 833 |
66 458 |
73 833 |
49 682 |
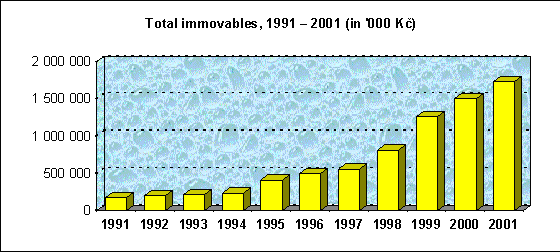
Tab. 14 – Total immovables, 1991 – 2001 (in '000 CZK)
|
1991 |
1992 |
1993 |
1994 |
1995 |
1996 |
1997 |
1998 |
1999 |
2000 |
2001 |
|
172 768 |
198 978 |
214 478 |
232 465 |
410 972 |
490 902 |
556 326 |
811 241 |
1 260 731 |
1 498 516 |
1 733 608 |
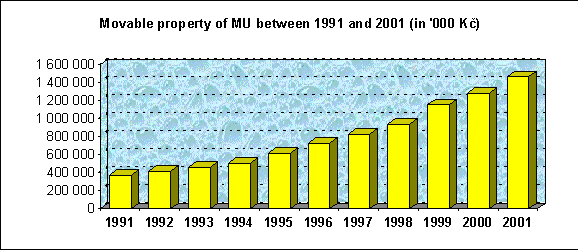
Tab. 15 – Movable property of MU between 1991 and 2001 (in '000 CZK)
|
1991 |
1992 |
1993 |
1994 |
1995 |
1996 |
1997 |
1998 |
1999 |
2000 |
2001 |
|
372 787 |
418 367 |
461 685 |
506 541 |
614 659 |
728 618 |
828 203 |
938 231 |
1 154 398 |
1 280 595 |
1 463 130 |
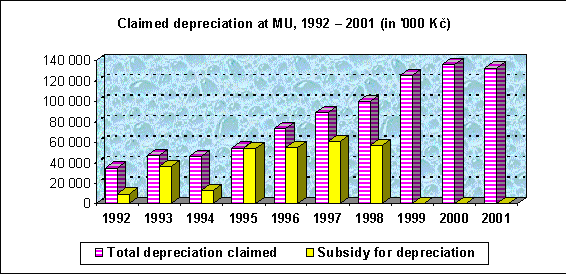
Tab. 16 – Claimed depreciation at MU, 1992 – 2001 (in '000 CZK)
|
|
1992 |
1993 |
1994 |
1995 |
1996 |
1997 |
1998 |
1999 |
2000 |
2001 |
|
depreciation |
35 220 |
47 605 |
46 025 |
54 675 |
73 598 |
89 169 |
100 144 |
125 535 |
136 815 |
133 044 |
|
depreciation subsidy |
10 000 |
36 355 |
13 588 |
54 435 |
55 397 |
60 801 |
57 544 |
0 |
0 |
0 |
|
Age |
Teaching staff |
research staff |
||||
|
|
full professors |
assoc. professors |
senior assistants |
assistants |
lecturers |
|
|
29 years |
– |
– |
161 |
181 |
17 |
17 |
|
30 – 39 years |
– |
28 |
99 |
55 |
8 |
8 |
|
40 – 49 years |
29 |
130 |
186 |
58 |
34 |
4 |
|
50 – 59 years |
55 |
100 |
87 |
24 |
23 |
3 |
|
60 – 69 years |
42 |
47 |
14 |
5 |
2 |
3 |
|
over 70 years |
42 |
15 |
3 |
3 |
1 |
6 |
Number of external and internal academic staff (actual and aggregate numbers)
|
Staffing |
Teaching staff |
Research staff |
|||||
|
|
full professors |
associate professors |
senior assistants |
assistants |
lecturers |
|
|
|
internal |
actual number |
168 |
320 |
550 |
326 |
85 |
35 |
|
|
aggregate number |
131.5 |
291.5 |
385.5 |
249.4 |
79.9 |
22.5 |
|
external |
actual number |
31 |
156 |
361 |
391 |
626 |
– |
|
|
aggregate number |
0.6 |
2.1 |
5.6 |
4.9 |
7.4 |
– |