Management
Ing. František Gale, Bursar
When Masaryk University entered the non-profit system of management on 1 January 1992 the main objective (under the existing economic conditions) was to form and continuously develop the principle of multi-resource funding.
Today, when we are assessing the year 1996, the fifth year of existence as a non-profit organisation, we can analyse and assess whether the project of the University management from the year 1992 succeeded.
The evaluation of the year 1996 in relation to the past five years of the University - is very significant because it can advocate, using precise figures, that the method of management is correct at the time of relative and absolute shortage of Government funds.
The present analysis is not only important for Masaryk University but the whole sector of Czech universities which are anticipating a new university act and new regulations of management and financing.
As evident from the following graphs and tables comparing the year 1996 with the previous years, Masaryk University has proved that the system of multi-resource funding, a certain level of autonomy in decision-making and interest lead to the development of universities even under the hard conditions of the present stage of the economic transformation in the Czech Republic.
The economic results of the year 1996 show that the University was successful in spite of unexpected funding reductions in the 4th quarter which amounted to 5% (more than 11.2 million CZK).
The final numbers of funds from the Ministry of Education reveal an absolute increase in comparison with the year 1995. But they should be viewed as a reflection of inflation which was almost 10 % in non-capital costs and even higher in capital costs.
Whereas in 1995 after eight budget alterations the fund for non-capital costs from the Ministry of Education was a total of 637.285 thousand CZK, in 1996 after four budget alterations the total sum including non-capital costs for depreciation was 728.155 thousand CZK (This sum is without 5 % reductions).
The development of funding reveals how important the economic activity of the University is and that its increase markedly helped to satisfy the needs of the University.
While in 1995 the income from economic activity was 85.196 thousand CZK, in 1996 the corresponding value was 100.197 thousand CZK out of which a total of 19 million will be available for the year 1997.
Though the rules for economic activity are clear in stating that most of the income belongs to the department which earned the money, the participation of departments was very different. It may be concluded that the potential of the University in this aspect has not been fully exploited yet.
An important or privileged area of the University's activity are investments. This is due to old and often dilapidated buildings and insufficient furnishings.
There was evidently an increase in all investment areas.
The investments in construction increased from 83.645 thousand CZK in 1995 to 121.095 thousand CZK in 1996.
The investments in machinery increased thanks to grants (the Ministry provided only 2.4 million CZK).
The total costs of machines and equipment increased to 130.792 thousand CZK from 82.602 thousand CZK in 1995.
In 1996 60 million CZK from special funds were used to purchase a suitable building which might serve as a hall of residence (500 beds) and to improve the bad situation in residential accommodation.
Re-investment in the amount of 70 million CZK obtained by selling the unsuitable building of the Faculty of Economics and Administration in Zelný trh 2/3, Brno, markedly influenced a quite optimistic level of investments in 1996 which amounted to 311.887 thousand CZK.
If we have a look at the year 1996 as a whole we can state that in spite of a number of problems connected with the system of university funding and the internal system of allocating resources to University departments, I, as Bursar of the University, am happy to say that the year 1996 was a successful one.
The economic result - after all budget uncertainties was 40.176 thousand CZK. This can
be attributed to the system of management and the form of organisation practised at the
University.
I am confident and the following indices are clear evidence that the last five years have
proved the success of the methods we have followed which have stimulated intellectual and
technical potential hidden at every university.
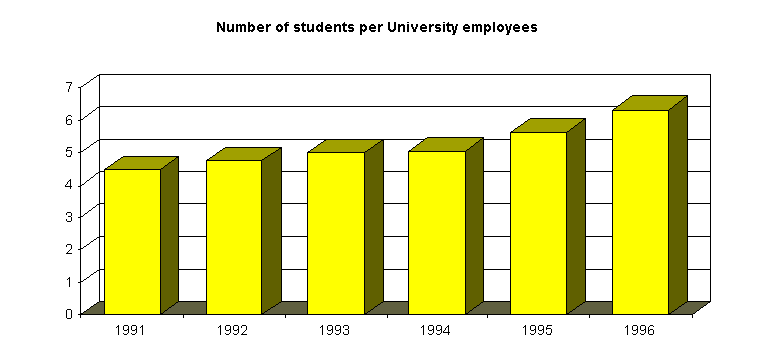
Table 1 Development
of the number of students per employees in 1991 - 1996
1991 |
1992 |
1993 |
1994 |
1995 |
1996 |
|
| Number of students | 9 728 |
10 575 |
11 544 |
11 629 |
12 837 |
15 401 |
| Number of employees | 2 182 |
2 232 |
2 309 |
2 309 |
2 275 |
2 435 |
| Students / employees | 4,46 |
4,74 |
5,00 |
5,04 |
5,64 |
6,32 |

Table 2
Statistics of employees and students - 1996
Employees |
Full-time students |
Total |
|||||||||
Fac. |
Teachers |
Others |
Total |
Number |
Stud. / |
Stud. / |
Stud. / |
Number |
Stud. / |
Stud. / |
Stud. / |
FM |
290,5 |
269,0 |
559,5 |
1560 |
5,37 |
5,80 |
2,79 |
1702 |
5,86 |
6,33 |
3,04 |
FA |
186,6 |
92,9 |
279,5 |
2860 |
15,33 |
30,79 |
10,23 |
3591 |
19,24 |
38,65 |
12,85 |
FL |
70,5 |
72,9 |
143,4 |
2275 |
32,27 |
31,21 |
15,86 |
2471 |
35,05 |
33,90 |
17,23 |
FS |
200,0 |
247,8 |
447,8 |
1685 |
8,43 |
6,80 |
3,76 |
2043 |
10,22 |
8,24 |
4,56 |
FI |
24,5 |
36,1 |
60,6 |
506 |
20,65 |
14,02 |
8,35 |
635 |
25,92 |
17,60 |
10,48 |
FE |
233,5 |
117,3 |
350,8 |
2660 |
11,39 |
22,68 |
7,58 |
3468 |
14,85 |
29,57 |
9,89 |
FEA |
57,0 |
45,5 |
102,5 |
1212 |
21,26 |
26,64 |
11,82 |
1247 |
21,88 |
27,41 |
12,17 |
Others |
72,7 |
417,8 |
490,5 |
|
|
|
|
244 |
|
|
|
Total |
1135,3 |
1299,3 |
2434,6 |
12758 |
11,24 |
9,82 |
5,24 |
15401 |
13,57 |
11,85 |
6,33 |
Table 3 Development of non-capital costs
per student in 1991 - 1996 (in thousands of CZK)
1991 |
1992 |
1993 |
1994 |
1995 |
1996 |
|
Non-capital subsidies, Min. of Edu. |
296 420 |
312 950 |
425 123 |
518 252 |
637 285 |
728 155 |
Number of students |
9 728 |
10 575 |
11 544 |
11 629 |
12 837 |
15 401 |
Non-capital costs/student |
30,47 |
29,59 |
36,83 |
44,53 |
49,64 |
47,28 |
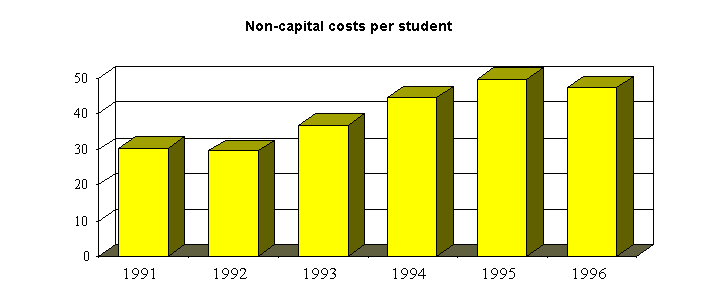
Table 4 Non-capital resources from grants in 1992 - 1996 in thousands of CZK
| Faculty | 1992 |
1993 |
1994 |
1995 |
1996 |
FM |
173 |
3.286 |
6.346 |
6.994 |
12.474 |
FA |
2.196 |
2.034 |
4.660 |
4.786 |
|
FL |
28 |
10 |
88 |
78 |
|
FS |
2.187 |
7.743 |
10.733 |
10.437 |
17.067 |
FI |
310 |
2.870 |
934 |
||
FE |
2.930 |
1.196 |
2.021 |
900 |
984 |
FEA |
386 |
80 |
157 |
1.048 |
1.282 |
Others |
7.888 |
15.134 |
24.631 |
15.133 |
|
| out of which: | |||||
RO |
500 |
170 |
|||
ICS |
21.460 |
14.212 |
|||
CCE |
2.671 |
751 |
|||
Total |
5.956 |
22.399 |
36.735 |
51.628 |
52.738 |
RO - Rector's Office
ICS - Institute of Computer Technology
CCE - Centre for Continuation of Education
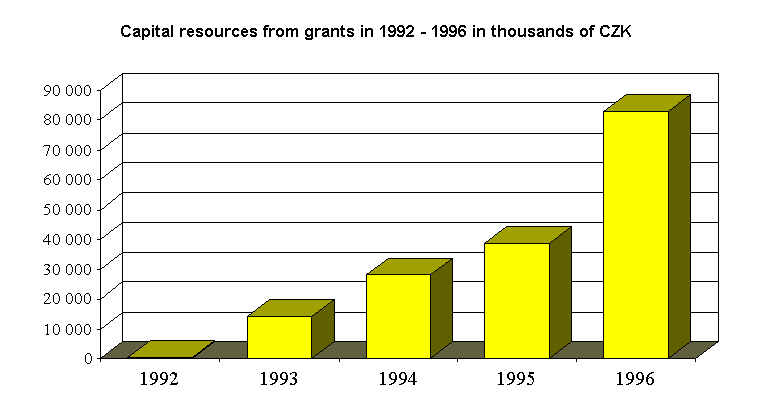
Table 5 Capital resources from grants in 1992 - 1996 in thousands of CZK
Faculty |
1992 |
1993 |
1994 |
1995 |
1996 |
FM |
1.260 |
2.500 |
9.526 |
3.823 |
|
FA |
352 |
519 |
1.524 |
1.499 |
|
FL |
75 |
40 |
|||
FS |
305 |
2.353 |
5.690 |
5.245 |
45.521 |
FI |
40 |
2.170 |
3.140 |
||
FE |
187 |
233 |
188 |
221 |
138 |
FEA |
45 |
157 |
33 |
0 |
|
Others |
10.049 |
19.153 |
19.903 |
28.665 |
|
| out of which: | |||||
RO |
30 |
||||
ICS |
19.713 |
28.635 |
|||
CCE |
190 |
0 |
|||
Total |
492 |
14.292 |
28.090 |
38.697 |
82.826 |
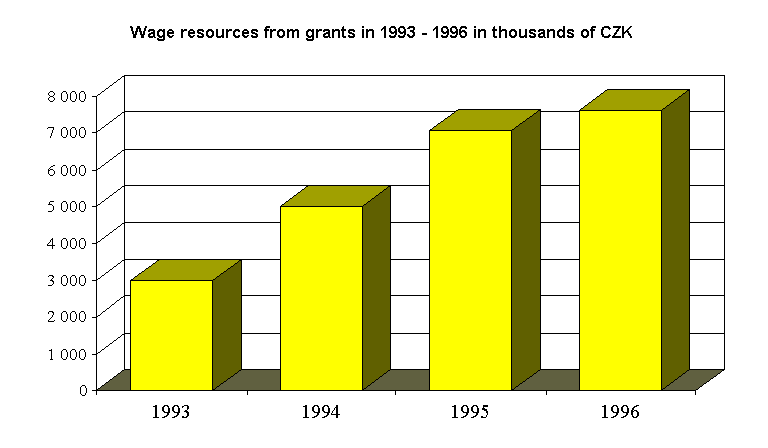
Table 6 Wage
resources from grants in 1993 - 1996 in thousands of CZK
Faculty |
1993 |
1994 |
1995 |
1996 |
FM |
82 |
834 |
995 |
1644 |
FA |
88 |
932 |
1.405 |
1286 |
FL |
15 |
41 |
||
FS |
238 |
1.510 |
2.375 |
3440 |
FI |
75 |
40 |
||
FE |
655 |
754 |
146 |
184 |
FEA |
137 |
12 |
519 |
294 |
Others |
1.810 |
948 |
1.528 |
693 |
out of which: |
||||
RO |
300 |
80 |
||
ICS |
38 |
188 |
275 |
|
CCE |
1.772 |
730 |
1.528 |
338 |
Total |
3.010 |
4.990 |
7.058 |
7.622 |
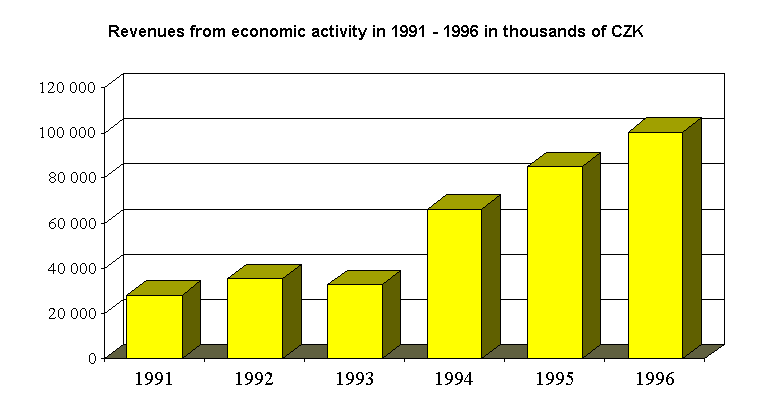
Table 7
Revenues from economic activity in 1991 - 1996 in thousands of CZK
Faculty |
1991 |
1992 |
1993 |
1994 |
1995 |
1996 |
FM |
|
|
5.610 |
19.816 |
29.949 |
32.617 |
FA |
|
|
1.804 |
4.003 |
3.293 |
1.946 |
FL |
|
|
9.686 |
19.030 |
14.083 |
20.698 |
FS |
|
|
7.240 |
8.786 |
9.349 |
9.254 |
FI |
|
|
|
|
|
691 |
FE |
|
|
1.456 |
465 |
860 |
1.376 |
FEA |
|
|
1.274 |
2.924 |
3.478 |
2.526 |
Others |
|
|
5.671 |
11.319 |
24.184 |
31.089 |
out of which |
||||||
RO |
|
|
|
|
16.813 |
24.618 |
special-purpose establishments |
|
|
|
|
3.181 |
5.896 |
All-university departments |
|
|
|
|
4.190 |
575 |
Total |
28.070 |
35.583 |
32.741 |
66.343 |
85.196 |
100.197 |
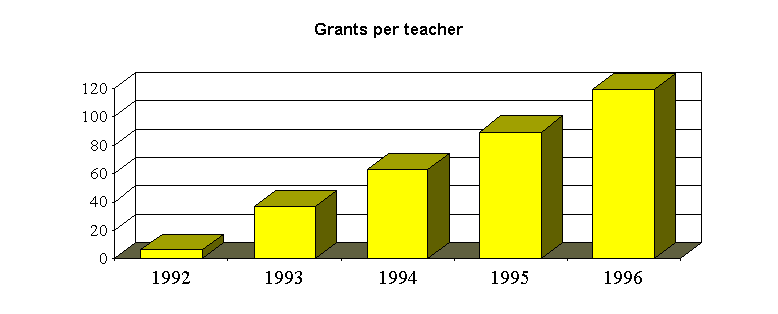
Table 8 Development of financial resources from grants per teacher in 1992 - 1996 in
thousands of CZK
1992 |
1993 |
1994 |
1995 |
1996 |
|
Development of financial resources from grants |
6 448 |
39 701 |
69 815 |
97 383 |
135 564 |
Number of teachers |
1 049 |
1 079 |
1 107 |
1 089 |
1 135 |
Grants / teacher |
6,15 |
36,79 |
63,07 |
89,42 |
119,44 |
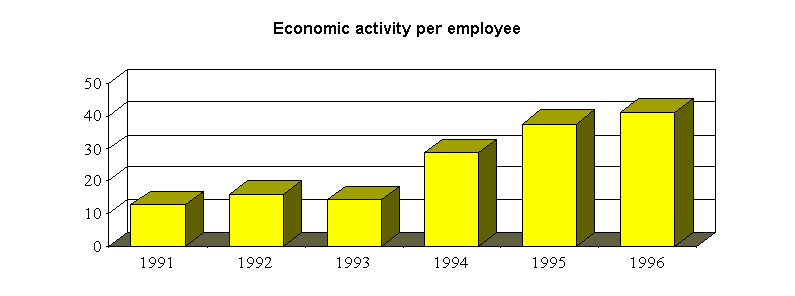
Table 9 Development of financial resources from economic activity per employee in 1991 -
1996 in thousands of CZK
1991 |
1992 |
1993 |
1994 |
1995 |
1996 |
|
Resources from economic activity |
28 070 | 35 583 | 32 741 | 66 343 | 85 196 | 100 197 |
Number of employees |
2 182 | 2 232 | 2 309 | 2 309 | 2 275 | 2 435 |
Economic activity/employee |
12,86 | 15,94 | 14,18 | 28,73 | 37,45 | 41,15 |
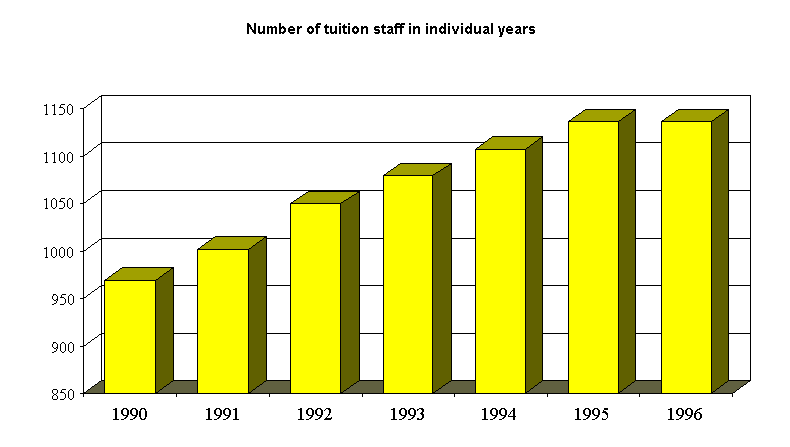
Table 10 Masaryk University employees in 1990 - 1995 (tuition staff)
1990 |
1991 |
1992 |
1993 |
1994 |
1995 |
1996 |
|
FM |
315,0 |
314,4 |
322,1 |
320,1 |
309,3 |
305,0 |
290,5 |
FA |
159,4 |
173,2 |
175,7 |
179,4 |
183,8 |
188,6 |
186,6 |
FL |
50,5 |
57,8 |
62,5 |
69,5 |
71,3 |
73,3 |
70,5 |
FS |
181,2 |
200,4 |
211,0 |
208,4 |
202,5 |
195,3 |
200,0 |
FI |
|
|
|
|
6,6 |
20,7 |
24,5 |
FE |
181,9 |
193,5 |
197,7 |
205,5 |
225,8 |
232,5 |
233,5 |
FEA |
|
8,6 |
13,2 |
21,2 |
29,9 |
47,2 |
57,0 |
Others |
81,4 |
54,2 |
67,0 |
75,0 |
78,2 |
72,6 |
72,7 |
Total |
969,4 |
1002,1 |
1049,2 |
1079,1 |
1107,4 |
1135,2 |
1135,3 |
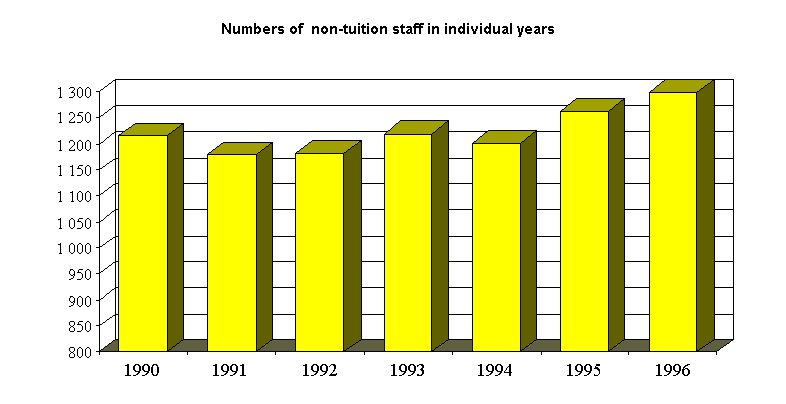
Table 11 University employees in 1990 - 1995 (others)
Faculty |
1990 |
1991 |
1992 |
1993 |
1994 |
1995 |
1996 |
FM |
278,8 |
277,4 |
268,5 |
271,1 |
267,0 |
269,6 |
269,0 |
FA |
84,3 |
88,5 |
88,5 |
93,7 |
93,2 |
88,1 |
92,9 |
FL |
42,2 |
57,2 |
54,0 |
66,9 |
65,3 |
80,5 |
72,9 |
FS |
234,3 |
223,7 |
226,9 |
234,5 |
232,8 |
245,3 |
247,8 |
FI |
|
|
|
|
|
19,7 |
36,1 |
FE |
115,1 |
105,9 |
102,1 |
101,1 |
103,3 |
112,9 |
117,3 |
FEA |
29,6 |
26,5 |
27,4 |
29,7 |
40,5 |
45,5 |
|
Others |
206,3 |
179,9 |
196,3 |
196,4 |
180,5 |
187,7 |
189,5 |
Accommodation and catering department |
255,6 |
217,7 |
220,0 |
230,6 |
226,2 |
217,8 |
228,3 |
Total |
1216,6 |
1179,9 |
1182,8 |
1219,7 |
1202,0 |
1262,1 |
1299,3 |
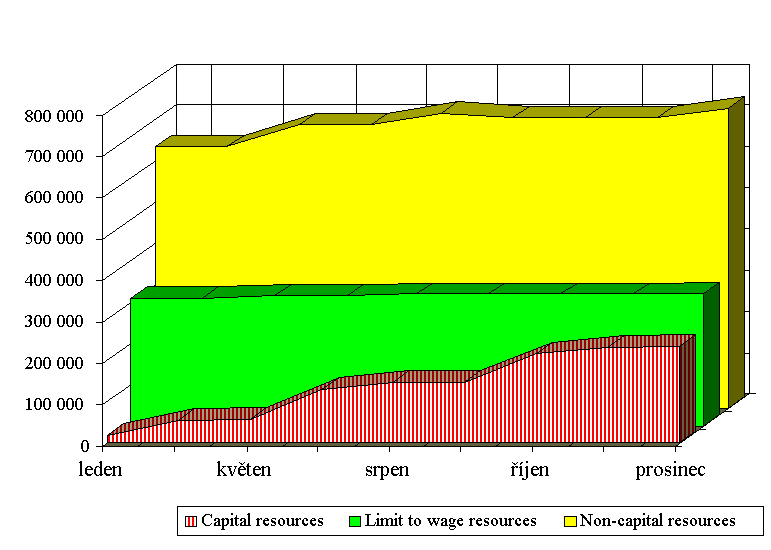
Table 12 Masaryk University funds in 1996 in thousands of CZK (a contribution from the
Ministry of Education)
Stage |
Non-capital resources |
Capital resources |
|
Total |
Limit to wage resources |
||
January |
633859 |
308571 |
19348 |
February |
0 |
0 |
34721 |
May |
52157 |
5848 |
3449 |
July |
0 |
0 |
71237 |
August |
29417 |
3388 |
17550 |
September |
-11269 |
0 |
60 |
October |
0 |
0 |
69706 |
November |
0 |
0 |
16146 |
December |
23991 |
1935 |
1670 |
Total |
728155 |
319742 |
233887 |
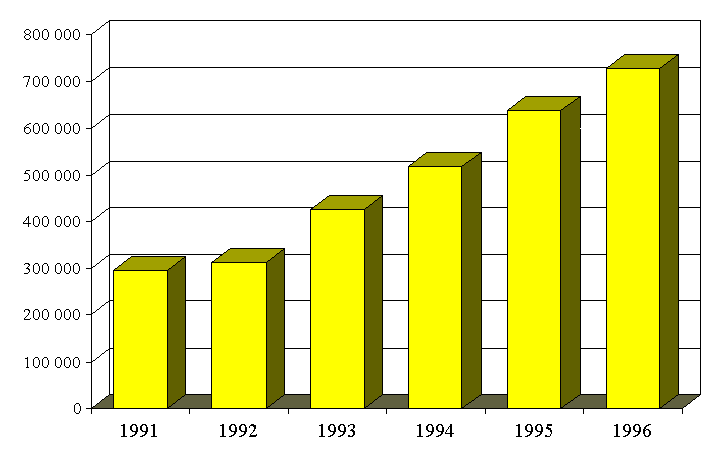
Table 13 Budgeted capital resources in 1991 - 1996 in thousands of CZK
1991 |
1992 |
1993 |
1994 |
1995 |
1996 |
296.420 |
312.950 |
425.123 |
518.252 |
637.285 |
728.155 |
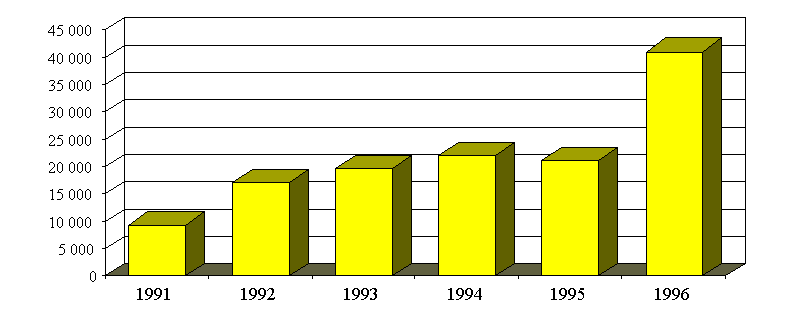
Table 14 Budget development at MU in 1996 - non-capital resources
Date |
Tuition |
Research |
Grants |
Accommodation and catering department |
Depreciation |
Foreign students and post-graduate students |
Others |
Total Contribution Limit to wage resources |
|
17.1. |
465968 |
76771 |
26077 |
55397 |
9646 |
633859 |
308571 |
||
29.5. |
23549 |
20507 |
8101 |
52157 |
5848 |
||||
22.8. |
18205 |
7090 |
4122 |
29417 |
3388 |
||||
29.9. |
-11269 |
-11269 |
|||||||
23.12. |
10984 |
1629 |
11378 |
23991 |
1935 |
||||
Celkem Total |
454699 |
76771 |
52738 |
46584 |
55397 |
18365 |
23601 |
728155 |
319742 |
Table 15 Costs of repairs of MU buildings in 1991 - 1996 in thousands of CZK
| Year | 1991 |
1992 |
1993 |
1994 |
1995 |
1996 |
| Sum | 9 451 |
17 061 |
19 738 |
22 155 |
21 192 |
41 023 |
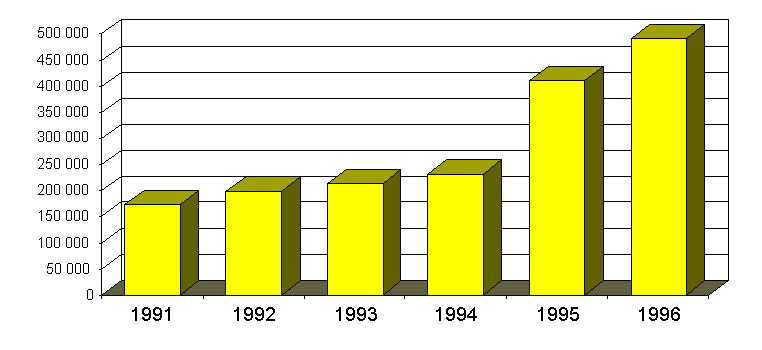
Table 16 Development of real estate in 1991 - 1996 in thousands of CZK
1991 |
1992 |
1993 |
1994 |
1995 |
1996 |
172.768 |
198.978 |
214.478 |
232.465 |
410.972 |
490.902 |
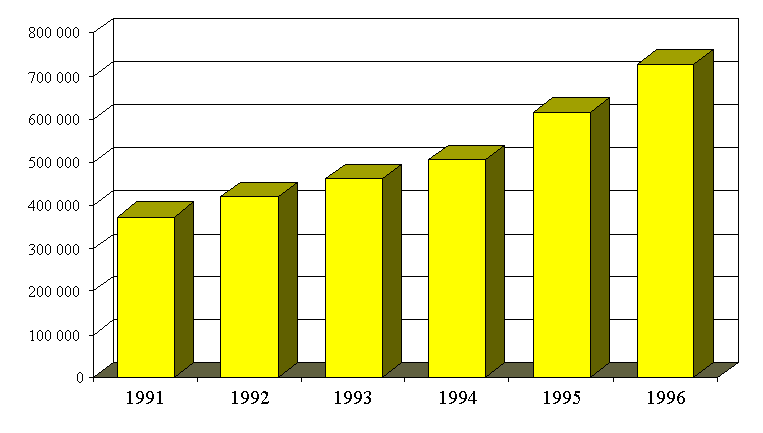
Table 17 Development of movable assets in 1991 - 1996 in thousands of CZK
1991 |
1992 |
1993 |
1994 |
1995 |
1996 |
372.787 |
418.367 |
461.685 |
506.541 |
614.659 |
728.618 |
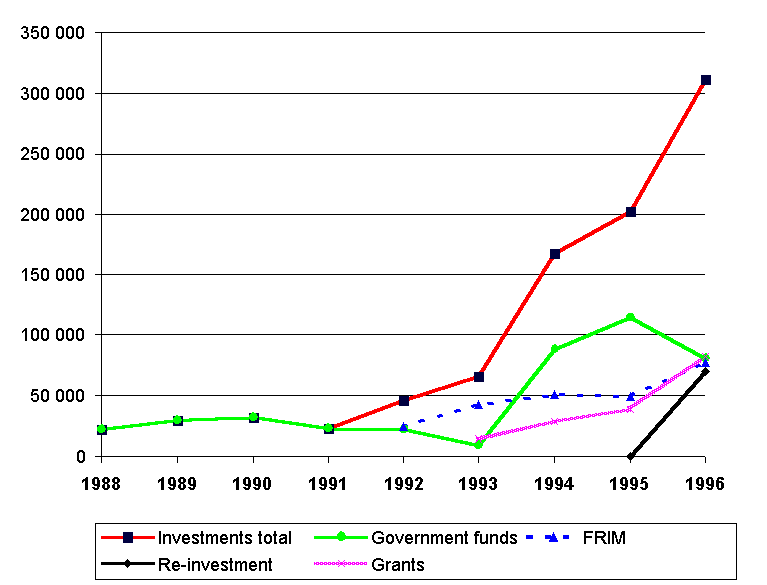
Table 18 Development of investments in 1988 - 1996 (in thousands of CZK)
1988 |
1989 |
1990 |
1991 |
1992 |
1993 |
1994 |
1995 |
1996 |
|
Construction investments |
|
|
|
|
|
|
|
|
|
Machinery investments |
|
|
|
|
|
|
|
|
|
Purchase of buildings |
|
|
|
|
|
|
|
|
|
Investment total |
|
|
|
|
|
|
|
|
|
Government funds |
|
|
|
|
|
|
|
|
|
IDF |
|
|
|
|
|
|
|
|
|
Re-investment |
|
|
|
|
|
|
|
|
|
Grants |
|
|
|
|
|
|
|
|
|
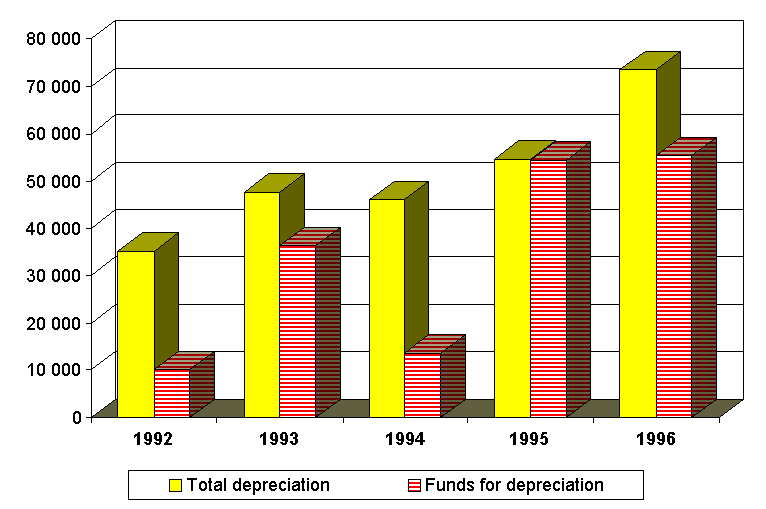
Table 19 Depreciation at MU in 1992 - 1996 in thousands of CZK
1992 |
1993 |
1994 |
1995 |
1996 |
|
Depreciation from property |
|
|
|
|
|
Depreciation from economic results of the previous year |
|
|
|
|
|
|
|
|
|
|
|
Funds for depreciation |
|
|
|
|
|
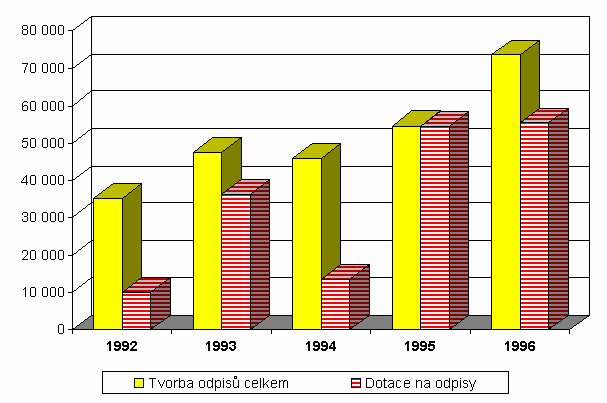
Table 20 Completed investment projects in thousands of CZK
Project |
Total capital costs |
Year of completion |
| Restoration of Kounicův Palace | 25.965 |
1995 |
| Restoration of Rector Office Žerotínovo nám 9 | 2.309 |
1995 |
| Redevelopment of the Faculty of Medicine Komenského nám. | 18.758 |
1995 |
| Statics measures at Faculty of Law Veveří 70 | 4.950 |
1995 |
| Completion of construction of Faculty Education Poříčí 9 - 11 | 71.524 |
1995 |
| Attic reconstruction at Faculty of Arts Grohova 7 | 4.145 |
1995 |
| Attic reconstruction at Faculty of Education Poříčí 9 - 11 | 1.853 |
1995 |
| Faculty of Law library Veveří 70 | 6.585 |
1995 |
| Reconstruction of greenhouses at Faculty of Science 1st stage | 8.361 |
1996 |
| Boiler house at Faculty of Education, Poříčí 7 | 2.169 |
1996 |
| Boiler house at Faculty of Education, Poříčí 31 | 2.447 |
1996 |
| Road within the campus of Faculty of Science, Kotlářská | 6.916 |
1996 |
| Greenhouses at Faculty of Science, 2nd stage | 16.979 |
1996 |
| Faculty of Law reading room Veveří | 6.285 |
1996 |
| Air conduit system, Canteen Veveří | 1.424 |
1996 |
| Computer network, Department of Geography | 425 |
1996 |
| air conditioning | 434 |
1996 |
| Safety appliance, Faculty of Law | 401 |
1996 |
| Expansion of computer network, Faculty of Science | 800 |
1996 |
Table 21 Investment project in progress in thousands of CZK
Project |
Capital costs |
Year |
||
Total |
until today |
Start |
End |
|
| Reconstruction of Faculty of Informatics | 73.519 | 10.475 | 1995 |
1998 |
| Faculty of Economics and Administration, Vinařská | 175.000 | 70.000 | 1996 |
1997 |
| Lecture rooms of Faculty Informatics, Botanická 68a | 21.307 | 4.597 | 1996 |
1997 |
Table 22 Future projects of construction in thousands of CZK
Year |
|||
Capital costs |
Start |
End |
|
| Reconstruction of Faculty of Medicine | 156.445 |
1996 |
1998 |
| Lecture rooms, Faculty of Economics and Administration | 63.135 |
1996 |
1998 |
| Boiler house reconstruction, Vinařská | 10.733 |
1996 |
1997 |
| Dampness control measures, Faculty of Law | 7.000 |
1996 |
1997 |
| Heat exchanger repairs, Faculty of Law | 2.710 |
1997 |
1997 |
| New Campus pavement Faculty of Science, Kotlářská | 845 |
1997 |
1997 |
| Roof repairs, Faculty of Arts | 900 |
1997 |
1997 |