Tab. 2 - Statistics of employees and students - 1996
Management
Ing. František Gale,
Bursar
The problems confronting the financing of institutes of higher education in the Czech Republic were signalled at the end of 1996 (a 5% cut in funding by December 31 1996), and in 1997 they presented themselves in their full force.
After the specifying of a financial contribution for 1997 which in January presented only 95% of the running costs declared as necessary, the so-called "government packages" came into effect. These heralded further cuts in running and salary costs and an increase in the time allotted for building work on University property under construction up to 1998/9.
Refraining from comments on the negative impact on property development, cuts in the funding of our university amounted to CZK 47.7 million. This dramatic interference in their running costs brought about financial losses for many institutes of higher education in the Czech Republic.
In such a situation, the fact that the economic outcome of Masaryk University was ultimately positive (though not as high as 1996) should be considered a great success.
Such an achievement was made possible by MU's contribution finance management scheme, which has been in effect since 1992. Use of funds in such a way as to allow the accumulation of the means as necessary and the holding over of finances from one year to another plus growth in economic and grant-related activities created the space for the active finance management of Masaryk University last year.
The figures for 1997, however, clearly show the manifold difficulties with which we were faced: the tables and diagrams below compare the course and results attained to those of previous years.
In the light of all this it is impossible to be overlook the relative success of MU's economic activities, through which a profit of almost CZK 100 million was recorded (a negligible decrease on the CZK 100.2 million profit of 1996).
Such a positive evaluation is not possible when one looks at developments in grant-related activities, however. In the field of investment grants, for example, we obtained only CZK 42 million, compared to the 1996 figure of almost CZK 83 million.
Conversely, grants in the field of wages amounted to CZK 12.7 million, up considerably on the 1996 figure of only CZK 7.6 million.
In 1997, our policy of acquisition was very successful. We obtained the large MEDIPO site in the Brno-Bohunice area - with a total value of CZK 177 million - for a total of CZK 118 million. This will be used for the development of the Faculty of Medicine (in 1997, CZK 38.6 million of the outlay was paid off). The University also bought a further hall of residence with capacity for c. 450 students at a value of CZK 67 million (CZK 50 million of which was paid off in 1997). In both cases, we received the fundings from extra-budget sources.
The City of Brno handed over to Masaryk University buildings for the development of the Faculty of Arts: the "Waterworks" building and lectors' house at Grohova 11.
The University obtained from VUT free letting (for the payment of running costs) of student accommodation: at on Antonínská for the Faculty of Economics and Administration and at Gorkého 5/7 for the Faculty of Social Studies.
It should be considered a great success on the part of MU management that the speed and extent of MU construction work kept to schedule in the face of the negative effects wrought by the "government packages".
The construction of the new building of the Faculty of Economics and Administration on the Vinaoská site together with reconstruction work on the Faculty of Informatics at Botanická 68a and the boiler room at Vinaoská were implemented, whilst work at the Botanical Gardens of the Faculty of Science and many smaller projects were brought to completion. All these activities ensure the development and modernization of MU as provided for in the "Programme of the Development of Masaryk University between 1996 and 2005".
In 1997, the total amount invested in construction work was CZK 204.4 million, with CZK 85.7 million invested in machinery.
The ensuring of property development for the future was another great success of 1997, and this mainly in respect of the reconstruction of a building belonging to the Faculty of Medicine on Komenský Square and the processing of an urbanisation study for the Brno-Bohunice site as approved by the Central Architects' Office in Brno.
Although we cannot oversee the financial problems of MU faculties, it is necessary to stress that - thanks to the great efforts of faculty managements and with the use of financial reserves created by MU over the past few years - we succeeded in overcoming many of the difficulties connected with MU's finances.
A comprehensive analysis of how MU's economy is managed is still before us. We can, however, say that 1997 was a successful year for the University. It is obvious that plans concerning MU's development in future will be closely connected to the development of the state budget and to increases or cuts in the funding of institutes of higher education in the Czech Republic.
We can evaluate last year's results in the realms of administration, investment and the care of properties in MU's trust as quite acceptable.
We cannot fail, however, to comment on the fact that 1997 saw a decrease or even stagnation in the speed of growth in many aspects and also that in some areas we failed to reach levels of the previous year. This resulted in a decrease in the University's overall economic outcome, which was able to remain positive only because of economy-related activities which MU undertook.
A critical analysis of 1997 should result in concrete measures directed both towards the "inside" and the "outside" (system measures at the level of origination). To guarantee the development and conditions needed for the smooth running of Masaryk University as a whole and also its individual units for the short- and medium-term is the main aim of our all activities.
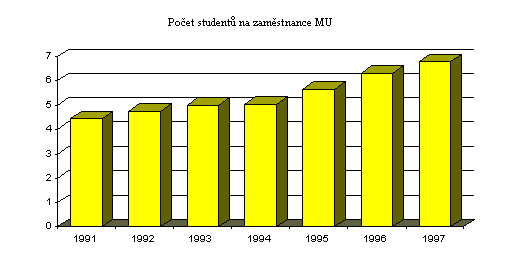
Table 1 - No. of students per MU employees 1991-1997
1991 |
1992 |
1993 |
1994 |
1995 |
1996 |
1997 |
|
| Number of students | 9 728 |
10 575 |
11 544 |
11 629 |
12 837 |
15 401 |
16741 |
| Number of employees | 2 |
2 232 |
2 309 |
2 309 |
2 275 |
2 435 |
2458 |
| Students/employees | 4,46 |
4,74 |
5,00 |
5,04 |
5,64 |
6,32 |
6,81 |

Tab. 2 - Statistics of employees and students - 1996
Employees |
Full-time students |
Total |
|||||||||
Faculty |
Teachers |
Others |
Total |
Number |
Stud./ |
Stud./ |
Stud./ |
Number |
Stud./ |
Stud./ |
Stud./ |
FM |
294,71 |
269,82 |
564,53 |
1577 |
5,35 |
5,84 |
2,79 |
1735 |
5,89 |
6,43 |
3,07 |
FA |
191,71 |
96,34 |
288,05 |
2800 |
14,61 |
29,06 |
9,72 |
3544 |
18,49 |
36,79 |
12,30 |
FL |
74,72 |
69,13 |
143,85 |
2357 |
31,54 |
34,10 |
16,39 |
2513 |
33,63 |
36,35 |
17,47 |
FS |
195,86 |
264,51 |
460,37 |
1842 |
9,40 |
6,96 |
4,00 |
2239 |
11,43 |
8,46 |
4,86 |
FI |
28,32 |
40,99 |
69,31 |
712 |
25,14 |
17,37 |
10,27 |
833 |
29,41 |
20,32 |
12,01 |
FE |
226,97 |
116,71 |
343,68 |
2974 |
13,10 |
25,48 |
8,65 |
3950 |
17,40 |
33,84 |
11,49 |
FEA |
58,29 |
39,17 |
97,46 |
1639 |
28,11 |
41,84 |
16,81 |
1689 |
28,98 |
43,12 |
17,33 |
Others |
74,06 |
192,96 |
267,02 |
0 |
0 |
0 |
0 |
238 |
0 |
0 |
0 |
ÚSKM |
0 |
224,19 |
224,19 |
0 |
0 |
0 |
0 |
0 |
0 |
0 |
0 |
Total |
1144,64 |
1313,82 |
2458,46 |
13901 |
12,14 |
10,58 |
5,65 |
16741 |
14,63 |
12,74 |
6,81 |
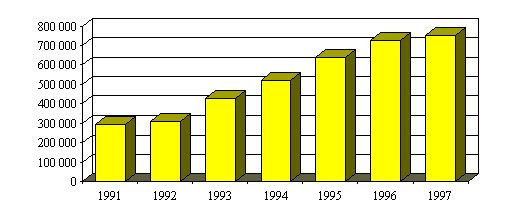
Table 3 - Non-capital costs per student 1991 - 1997 (in thousands of CZK)
1991 |
1992 |
1993 |
1994 |
1995 |
1996 |
1997 |
|
| Non-capital subsidies, Min. of Edu. |
296 420 | 312 950 | 425 123 | 518 252 | 637 285 | 728 155 |
751 761 |
| Number of students | 9 728 |
10 575 |
11 544 |
11 629 |
12 837 |
15 401 |
16 741 |
| Non-capital costs/student | 30,47 |
29,59 |
36,83 |
44,53 |
49,64 |
47,28 |
44,91 |
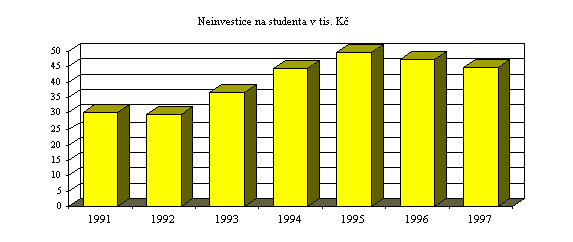
Table 4 - Non-capital resources received in grants 1992 - 1997 (in thousands of CZK)
Faculty |
1992 |
1993 |
1994 |
1995 |
1996 |
1997 |
FM |
173 |
3.286 |
6.346 |
6.994 |
12.474 |
13.962 |
FA |
2.196 |
2.034 |
4.660 |
4.786 |
6.794 |
|
FL |
28 |
10 |
88 |
78 |
207 |
|
FS |
2.187 |
7.743 |
10.733 |
10.437 |
17.067 |
22.507 |
FI |
|
310 |
2.870 |
934 |
523 |
|
FE |
2.930 |
1.196 |
2.021 |
900 |
984 |
1.756 |
FEA |
386 |
80 |
157 |
1.048 |
1.282 |
1.496 |
Others |
|
7.888 |
15.134 |
24.631 |
15.133 |
4.027 |
out of which: |
||||||
RMU |
|
|
|
500 |
170 |
316 |
ICS |
|
|
|
21.460 |
14.212 |
2.900 |
CCE |
|
|
|
2.671 |
751 |
811 |
Total |
5.956 |
22.399 |
36.735 |
51.628 |
52.738 |
51.272 |
RMU - Rector's Office
ICS - Institute of Computer Technology
CCE - Centre for Continuation of Education
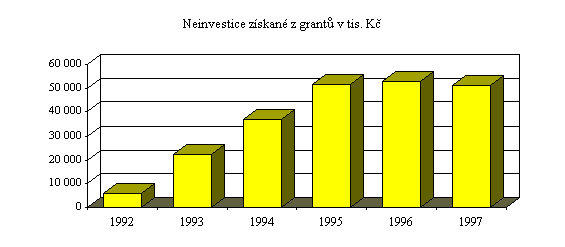
Table 5 - Capital resources received in grants 1992 - 1997 (in thousands of CZK)
Faculty |
1992 |
1993 |
1994 |
1995 |
1996 |
1997 |
FM |
|
1.260 |
2.500 |
9.526 |
3.823 |
1.832 |
FA |
352 |
519 |
1.524 |
1.499 |
1.123 |
|
FL |
|
75 |
40 |
594 |
||
FS |
305 |
2.353 |
5.690 |
5.245 |
45.521 |
19.298 |
FI |
|
|
40 |
2.170 |
3.140 |
1.689 |
FE |
187 |
233 |
188 |
221 |
138 |
340 |
FEA |
45 |
157 |
33 |
0 |
0 |
|
Others |
|
10.049 |
19.153 |
19.903 |
28.665 |
17.077 |
out of whitch: |
||||||
RMU |
|
|
|
|
30 |
0 |
ICS |
19.713 |
28.635 |
17.077 |
|||
CCE |
|
|
|
190 |
0 |
0 |
Total |
492 |
14.292 |
28.090 |
38.697 |
82.826 |
41.953 |
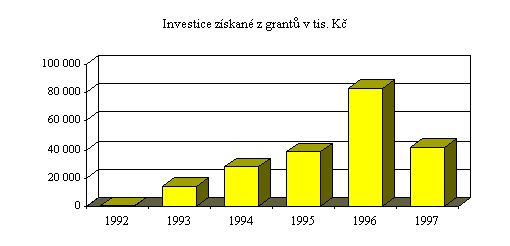
Table 6 - Wage resources received in grants 1992 - 1997 (in thousands of CZK)
Faculty |
1993 |
1994 |
1995 |
1996 |
1997 |
FM |
82 |
834 |
995 |
1644 |
3448 |
FA |
88 |
932 |
1.405 |
1286 |
1845 |
FL |
15 |
41 |
42 |
||
FS |
238 |
1.510 |
2.375 |
3440 |
5971 |
FI |
75 |
40 |
106 |
||
FE |
655 |
754 |
146 |
184 |
334 |
FEA |
137 |
12 |
519 |
294 |
415 |
Others |
1.810 |
948 |
1.528 |
693 |
504 |
out of which: |
|||||
RMU |
30 |
80 |
30 |
||
ICS |
38 |
188 |
275 |
170 |
|
CCE |
1.772 |
730 |
1.528 |
338 |
304 |
Total |
3.010 |
4.990 |
7.058 |
7.622 |
12.665 |
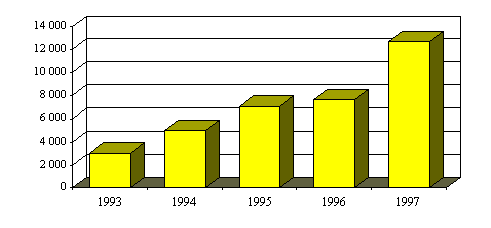
Faculty |
1991 |
1992 |
1993 |
1994 |
1995 |
1996 |
1997 |
| FM | 5.610 |
19.816 |
29.949 |
32.617 |
37.071 |
||
| FA | 1.804 |
4.003 |
3.293 |
1.946 |
2.422 |
||
| FL | 9.686 |
19.030 |
14.083 |
20.698 |
18.083 |
||
| FS | 7.240 |
8.786 |
9.349 |
9.254 |
9.712 |
||
| FI | 691 |
180 |
|||||
| FE | 1.456 |
465 |
860 |
1.376 |
1.185 |
||
| FEA | 1.274 |
2.924 |
3.478 |
2.526 |
3.087 |
||
| Others | 5.671 |
11.319 |
24.184 |
31.089 |
27.955 |
||
| out of which: | |||||||
| RMU | 16.813 |
24.618 |
24.917 |
||||
| special-purpose establishments |
3.181 |
5.896 |
5 |
||||
| All-university departments |
4.190 |
575 |
3.033 |
||||
| Total | 28.070 |
35.583 |
32.741 |
66.343 |
85.196 |
100.197 |
99.695 |
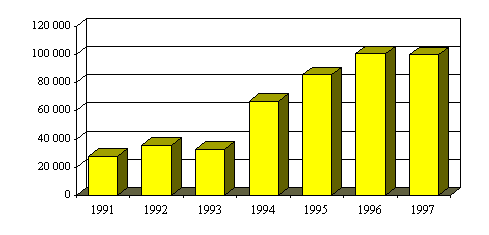
Table 8 - Resources in grants per teacher 1992 - 1997 (in thousands of CZK)
1992 |
1993 |
1994 |
1995 |
1996 |
1997 |
|
| Development of financial resources from grants |
6 448 |
39 701 |
69 815 |
97 383 |
135 564 |
93 225 |
| Number of teachers | 1 049 |
1 079 |
1 107 |
1 089 |
1 135 |
1 145 |
| Grants / teacher | 6,15 |
36,79 |
63,07 |
89,42 |
119,44 |
81,42 |
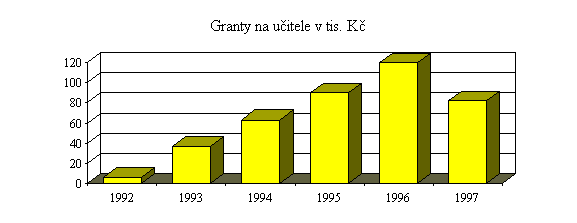
Table 9 - Resources generated by economic activities per employee 1991 - 1997 (in thousands of CZK)
1991 |
1992 |
1993 |
1994 |
1995 |
1996 |
1997 |
|
| Resources from economic activity | 28 070 |
35 583 |
32 741 |
66 343 |
85 196 |
100 197 |
99 695 |
| Number of employees | 2 182 |
2 232 |
2 309 |
2 309 |
2 275 |
2 435 |
2 448 |
| Economic activity/employee | 12,86 |
15,94 |
14,18 |
28,73 |
37,45 |
41,15 |
40,72 |
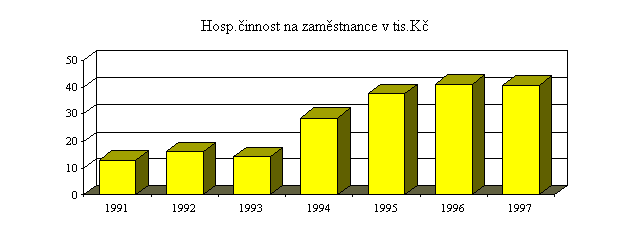
Table 10 - MU employees 1990 - 1997 (teaching staff)
1990 |
1991 |
1992 |
1993 |
1994 |
1995 |
1996 |
1997 |
|
FM |
315,0 |
314,4 |
322,1 |
320,1 |
309,3 |
305,0 |
290,5 |
294,71 |
FA |
159,4 |
173,2 |
175,7 |
179,4 |
183,8 |
188,6 |
186,6 |
191,71 |
FL |
50,5 |
57,8 |
62,5 |
69,5 |
71,3 |
73,3 |
70,5 |
74,72 |
FS |
181,2 |
200,4 |
211,0 |
208,4 |
202,5 |
195,3 |
200,0 |
195,86 |
FI |
|
|
|
|
6,6 |
20,7 |
24,5 |
28,32 |
FE |
181,9 |
193,5 |
197,7 |
205,5 |
225,8 |
232,5 |
233,5 |
226,97 |
FEA |
|
8,6 |
13,2 |
21,2 |
29,9 |
47,2 |
57,0 |
58,29 |
Others |
81,4 |
54,2 |
67,0 |
75,0 |
78,2 |
72,6 |
72,7 |
74,06 |
Total |
969,4 |
1002,1 |
1049,2 |
1079,1 |
1107,4 |
1135,2 |
1135,3 |
1144,64 |
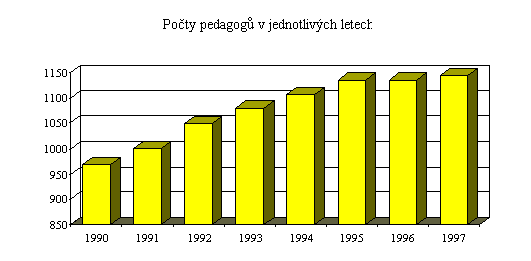
Table 11 - MU employees 1990 - 1997 (non-teaching staff)
Faculty |
1990 |
1991 |
1992 |
1993 |
1994 |
1995 |
1996 |
1997 |
FM |
278,8 |
277,4 |
268,5 |
271,1 |
267,0 |
269,6 |
269,0 |
269,82 |
FA |
84,3 |
88,5 |
88,5 |
93,7 |
93,2 |
88,1 |
92,9 |
96,34 |
FL |
42,2 |
57,2 |
54,0 |
66,9 |
65,3 |
80,5 |
72,9 |
69,13 |
FS |
234,3 |
223,7 |
226,9 |
234,5 |
232,8 |
245,3 |
247,8 |
264,51 |
FI |
|
|
19,7 |
36,1 |
40,99 |
|||
FE |
115,1 |
105,9 |
102,1 |
101,1 |
103,3 |
112,9 |
117,3 |
116,71 |
FEA |
29,6 |
26,5 |
27,4 |
29,7 |
40,5 |
45,5 |
39,17 |
|
Others |
206,3 |
179,9 |
196,3 |
196,4 |
180,5 |
187,7 |
189,5 |
192,96 |
ÚSKM |
255,6 |
217,7 |
220,0 |
230,6 |
226,2 |
217,8 |
228,3 |
224,19 |
Total |
1216,6 |
1179,9 |
1182,8 |
1219,7 |
1202,0 |
1262,1 |
1299,3 |
1313,82 |
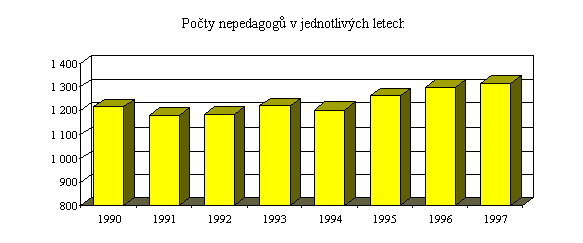
Table 12 - MU funding 1997 (in thousands of CZK; awarded by the Ministry of Education, Youth and Physical
Education)
| Stage | Non-capital resources | Capital resources | |
Total |
Limit to wage resources |
||
January |
663389 |
349827 |
194397 |
February |
4568 |
||
April |
30741 |
2608 |
30211 |
May |
-9960 |
||
June |
73016 |
10250 |
583 |
July |
-18622 |
-14560 |
-24505 |
August |
-12399 |
-9463 |
36800 |
Oktober |
10607 |
-47 |
1151 |
November |
2679 |
-2177 |
7345 |
December |
2350 |
-2705 |
50000 |
Total |
751161 |
333733 |
290590 |
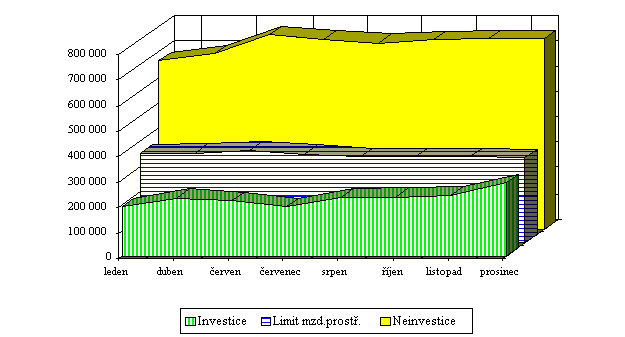
Table 13 - Budgeted non-capital resources 1991 - 1997 (in thousands of CZK)
1991 |
1992 |
1993 |
1994 |
1995 |
1996 |
1997 |
296.420 |
312.950 |
425.123 |
518.252 |
637.285 |
728.155 |
751.761 |
| Date | Tuition |
Research |
Grants |
Accommodation |
Depreciation |
Foreign |
Others |
Krácení (vlád.bal.) |
Total Contribution Limit to |
|
22.1. |
493 741 |
84 775 |
55 084 |
17 794 |
11 995 |
663 389 |
349 827 |
|||
22.4. |
7 106 |
9 638 |
13 997 |
30 741 |
2 608 |
|||||
4.6. |
29 159 |
43 007 |
850 |
73 016 |
10 250 |
|||||
7.7 |
6 612 |
4 047 |
-29 281 |
-18 622 |
-14 560 |
|||||
29.8. |
3 762 |
2 067 |
-18 228 |
-12 399 |
-9 463 |
|||||
22.10. |
76 |
10 697 |
-166 |
10 607 |
-47 |
|||||
27.11. |
2 004 |
675 |
2 679 |
-2 177 |
||||||
12.12. |
21 |
479 |
1 850 |
2 350 |
-2 705 |
|||||
Total |
493 741 |
91 881 |
51 272 |
55 084 |
60 801 |
23 171 |
23 486 |
-47 675 |
751 761 |
333 733 |
Table 15 - Costs of maintenance of MU buildings 1991 - 1997 (in thousands of CZK)
| Year | 1991 |
1992 |
1993 |
1994 |
1995 |
1996 |
1997 |
| Sum | 9 451 |
17 061 |
19 738 |
22 155 |
21 192 |
41 023 |
48 685 |
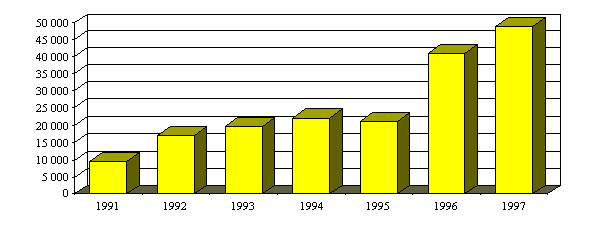
Table 16 - Immovable assets 1991 - 1997 (in thousands of CZK)
1991 |
1992 |
1993 |
1994 |
1995 |
1996 |
1997 |
172.768 |
198.978 |
214.478 |
232.465 |
410.972 |
490.902 |
556.326 |
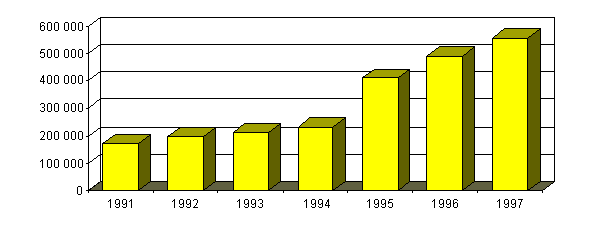
Table 17 - Movable assets 1991 - 1997 (in thousands of CZK)
1991 |
1992 |
1993 |
1994 |
1995 |
1996 |
1997 |
372.787 |
418.367 |
461.685 |
506.541 |
614.659 |
728.618 |
828.203 |
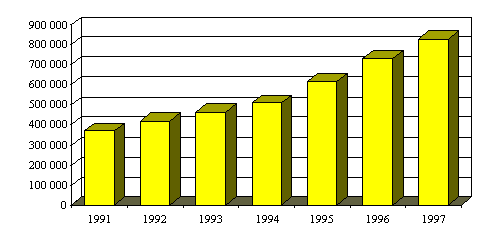
Table 18 - MU investment activities and their
financing 1988 - 1997 (in thousands of CZK)
1988 |
1989 |
1990 |
1991 |
1992 |
1993 |
1994 |
1995 |
1996 |
1997 |
|
Construction |
|
|
|
|
|
|
|
|
|
|
Machinery |
|
|
|
|
|
|
|
|
|
|
| Purchase of buildings from Government funds |
|
|
|
|
|
|
|
|
|
|
| Investment total |
|
|
|
|
|
|
|
|
|
|
|
|
|
|
|
|
|
|
|
|
|
|
|
|
|
|
|
|
|
|
|
|
|
|
|
|
|
|
|
|
|
|
|
|
|
|
|
|
|
|
|
|
|
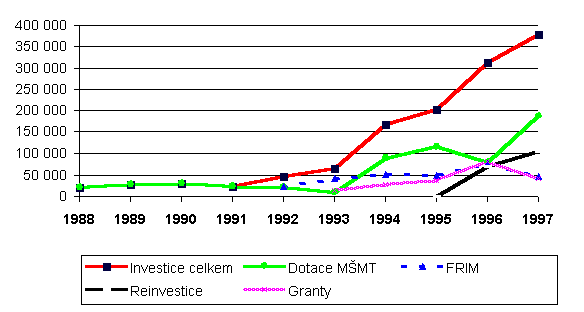
Table 19 - Depreciation at MU 1992 - 1997 (in thousands of CZK)
1992 |
1993 |
1994 |
1995 |
1996 |
1997 |
|
| Depreciation from property | 35220 |
36395 |
39696 |
44946 |
60755 |
79169 |
| Depreciation from economic results of the previous year |
11210 |
6329 |
9729 |
12843 |
10000 |
|
| Total depreciation | 35220 |
47605 |
46025 |
54675 |
73598 |
89169 |
Funds for depreciation |
10000 |
36355 |
13588 |
54435 |
55397 |
60801 |
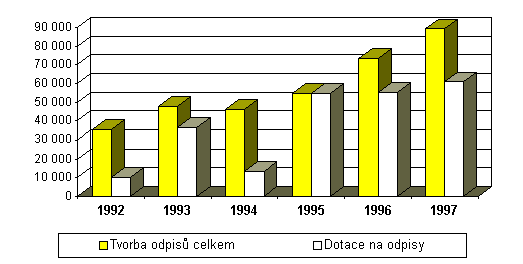
Table 20 - Investment projects completed (in thousands of CZK)
Project |
Total capital costs |
Year of completion |
| Rekonstrukce skleníků PřF, 1. etapa |
8.361 |
1996 |
| Kotelna PdF, Poříčí 7 |
2.169 |
1996 |
| Kotelna PdF, Poříčí 31 |
2.447 |
1996 |
| Komunikace PřF, Kotlářská |
6.916 |
1996 |
| Skleníky PřF 2. etapa | 16.979 |
1996 |
| Studovna PrF, Veveří |
6.285 |
1996 |
| Vzduch. Menzy Veveří | 1.424 |
1996 |
| Počítač. síť katedry Geografie | 425 |
1996 |
| Kounicův palác - klimatizace | 434 |
1996 |
| Zabezpeč. zařízení PrF | 401 |
1996 |
| Rozšíř. poč. sítě PřF | 800 |
1996 |
| Posluchárny FI, Botanická 68 |
22.164 |
1997 |
| Sanace vlhkosti PrF, Veveří 70 |
4.913 |
1997 |
| Vzduchotechnika pro studov., PrF, Veveří 70 |
2.709 |
1997 |
| Rekonstrukce kotelny, Vinařská |
12.822 |
1997 |
| FF - rekonstrukce střechy | 986 |
1997 |
| Zpevněné plochy PřF, Kotlářská |
430 |
1997 |
| Seismická stanice Vranov | 671 |
1997 |
Table 21 - Investment projects in progress (in thousands of CZK)
Project |
Capital costs |
Year |
||
Total |
Until today |
Start |
End |
|
| Rekonstrukce FI, Botanická 68a |
54.626 |
22.132 |
1997 |
1998 |
| EsF - posluchárny, Vinařská | 238.135 |
215.055 |
1996 |
1998 |
| Nákup areálu MEDIPO | 118.000 |
36.800 |
1997 |
1998 |
Table 22 - Investment in construction planned (in
thousands of CZK)
Year |
|||
Capital costs |
Start |
End |
|
| REKO a moder. LF, Komenského nám.2 |
180.860 |
1997 |
2000 |
| LF-rekonstr. a dostavba areálu MEDIPO | 168.000 |
1998 |
1999 |
| FF - ústřední knihovna | 50.000 |
1998 |
2000 |
| PřF - půdní vestavba | 3.375 |
1998 |
1998 |
| ÚSKM-průchod, Vinařská |
1.200 |
1998 |
1998 |
| FI - rekostr. nádvoří a zabezpečení | 3.300 |
1998 |
1998 |
| PdF - Kejbaly plynofikace |
350 |
1998 |
1998 |