Ing. František Gale, Bursar
In this annual report, we have been reviewing the 1999 calendar year in order to evaluate and compare its economic indicators with indicators of previous years. The economic and qualitative indicators document the activity of Masaryk University, and objectify statements described in the report.
Each year has its own characteristics. Each period evaluated reflects both the internal situation of the university and economic situation in the Czech Republic. The economic situation plays a fundamental role in the evaluation of all organizations which are economically dependent on the state budget.
What were the external and internal conditions of the year 1999?
With regard to all the difficulties of 1999, it is possible to consider this year as a transformation period for MU, in which it was necessary to solve all operational problems and maintain the investment plan.
Concerning MU financing, the following issues were the most problematic:
The above-described ministerial decisions caused complications for Masaryk University, especially its faculties.
At the beginning of 1999, in spite of MU’s efforts to minimize redistribution processes at the university, it was necessary to reduce to the minimum level the financial requirements of individual MU faculties. At the same time, the university focused on gaining financing from sources other sources than the state budget.
Despite all efforts - and for the first time since November 1989 - Masaryk University experienced a loss amounting to CZK 3.8. mill. in operational means.
Comparing the figures of the year 1999, the total profit amounted to CZK 1.177 billion and total expenses to CZK 1.181 billion, i.e. there was a minimal loss covered by the reserve fund.
On the other hand, however, the negative economic result was a warning signal; with regard to the further development of the university and the ”Long-term Outlook of Masaryk University up to the Year 2005” document, it is necessary to find a fundamental solution for MU financing.
The level of MU’s economic loss was offset by income from supplementary activities amounting to CZK 25.2 million.
Concerning the main MU activities, the loss amounted to CZK 29 million. This fact means that at future negotiations with the Ministry of Education, it will be necessary to insist on the changing of its appropriation policy conditions. All universities similar to Masaryk University lose out by the outdated normative financing of faculties with a low demand coefficient. Development of the last five years has shown that the use of computer technology at faculties specializing in humanities and ”virtualization” of many laboratory processes at technical faculties have obliterated the former dividing of faculties into so called ”cheap” and ”expensive” (manifested in different coefficients).
Another significant economic factor is the growth of depreciations, which have become part of educational subsidies, and reduce excessively - especially in the case of active universities - the total sum of financing necessary for running the university.
The above-stated system drawbacks are not the only factors influencing the economic performance of the university. The activities of MU faculties and its sections are another significant aspect, as the faculties did not manage to decrease their expenses and increase necessary output.
The profit of Masaryk University amounted to CZK 216 million from its main activity and c. 82 million from supplementary activities; the current level of MU development, however, requires faster growth in its output.
In 1999, the state budget subsidy for MU amounted to CZK 879.9 million but with regard to the ministerial coefficient system, Masaryk University received c. CZK 100 million less then the Technical University (VUT Brno), the size and equipment requirements of which are comparable to those of our university. This fact has to be analysed and used as an argument for necessary changes in the appropriation policy of the Ministry of Education, Youth and Sport of the Czech Republic.
Investments are an independent part of the evaluation of the year 1999. In this field, we have succeeded to maintain the trend of previous years. Masaryk University invested a total of CZK 254.8 million, of that CZK 107.3 from its own sources.
An amount of CZK 101 million from the state budget was used for building projects, CZK 42 million for sources not included in investments.
The Investment Property Reproduction Fund (FRIM) consists mainly of depreciations and increases investment activities. On the other hand, it burdens the operational field with depreciations of investment properties as the subsidies do not respect investment growth (especially by grant activities).
In the field of research and development, we have received a total of CZK 182 million, of which CZK 75.6 million was for creative achievement. In comparison with 1998, this means a subsidy growth; our university, however, needs a higher sum for the implementation of a greater number of activities and projects in the field of research and development.
A supplementary subsidy for the Halls of Residence and Refectories Administration amounted to CZK 51 million. That sum is lower than in 1998, and shows that it is necessary to search for new solutions.
With regard to the fulfilment of the 1998 analysis, we may state that the year 1999 was a relatively balanced year, during which, however, MU had to face negative influences at ministerial (system problems in the ministerial appropriation policy) and university levels (failing in maintenance of a positive economic result).
With regard to the above statement, the year 2000 will be of fundamental importance, and should not allow the situation of previous years when it did not respond as necessary to the expected development of MU.
|
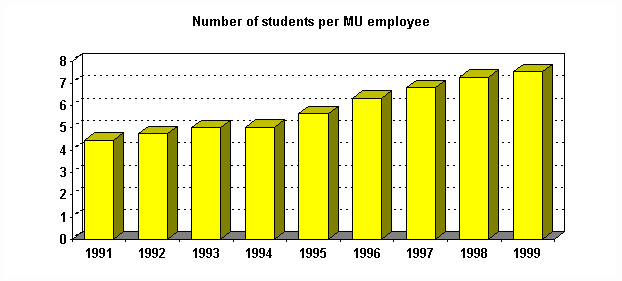
Table 1 - Number of students in comparison with number of employees 1991-1999 |
|||||||||
|
1991 |
1992 |
1993 |
1994 |
1995 |
1996 |
1997 |
1998 |
1999 |
|
|
Number of students |
9 728 |
10 575 |
11 544 |
11 629 |
12 837 |
15 401 |
16 741 |
18 026 |
18 785 |
|
Num. of employees |
2 182 |
2 232 |
2 309 |
2 309 |
2 275 |
2 435 |
2 458 |
2 477 |
2 497 |
|
Student/employee |
4,46 |
4,74 |
5,00 |
5,04 |
5,64 |
6,32 |
6,81 |
7,28 |
7,52 |

|
Table 2 - Statistics of employees and students - 1999 |
|||||||||||
|
|
Employees |
Degree students |
All students |
||||||||
|
Faculty |
teachers |
others |
total |
number |
student/ teacher ratio |
Stud. / others ratio |
Stud. / total ratio |
number |
student/ teacher ratio |
Stud. / others ratio |
Stud. / total ratio |
|
FM |
303,64 |
221,72 |
525,36 |
2 003 |
6,60 |
9,03 |
3,81 |
2 003 |
6,60 |
9,03 |
3,81 |
|
FA |
171,33 |
84,20 |
255,53 |
3 008 |
17,56 |
35,72 |
11,77 |
3 008 |
17,56 |
35,72 |
11,77 |
|
FL |
73,97 |
64,51 |
138,48 |
2 451 |
33,14 |
37,99 |
17,70 |
2 451 |
33,14 |
37,99 |
17,70 |
|
SchSS |
32,69 |
21,87 |
54,56 |
935 |
28,60 |
42,75 |
17,14 |
935 |
28,60 |
42,75 |
17,14 |
|
FS |
211,74 |
276,68 |
488,42 |
2 356 |
11,13 |
8,52 |
4,82 |
2 360 |
11,15 |
8,53 |
4,83 |
|
FI |
43,38 |
48,24 |
91,62 |
1 217 |
28,05 |
25,23 |
13,28 |
1 240 |
28,58 |
25,70 |
13,53 |
|
FE |
214,56 |
112,16 |
326,72 |
3 574 |
16,66 |
31,87 |
10,94 |
4 144 |
19,31 |
36,95 |
12,68 |
|
FEA |
61,94 |
55,57 |
117,51 |
2 211 |
35,70 |
39,79 |
18,82 |
2 211 |
35,70 |
39,79 |
18,82 |
|
Others |
82,04 |
194,44 |
276,48 |
0 |
0 |
0 |
0 |
433 |
5,28 |
2,23 |
1,57 |
|
SKM |
0 |
222,27 |
222,27 |
0 |
0 |
0 |
0 |
0 |
0 |
0 |
0 |
|
Total |
1195,29 |
1301,66 |
2496,95 |
17 755 |
14,85 |
13,64 |
7,11 |
18 785 |
15,72 |
14,43 |
7,52 |
|
Table 3 - Non-investment means per student 1991-1999 in thousands of CZK |
|||||||||
|
1991 |
1992 |
1993 |
1994 |
1995 |
1996 |
1997 |
1998 |
1999 |
|
|
Non-investment funding of the Ministry of Education |
296 420 |
312 950 |
425 123 |
518 252 |
637 285 |
728 155 |
751 761 |
851 717 |
879 955 |
|
Number of students |
9 728 |
10 575 |
11 544 |
11 629 |
12 837 |
15 401 |
16 741 |
18 026 |
18 875 |
|
Non-investments/student |
30,47 |
29,59 |
36,83 |
44,53 |
49,64 |
47,28 |
44,91 |
47,25 |
46,62 |
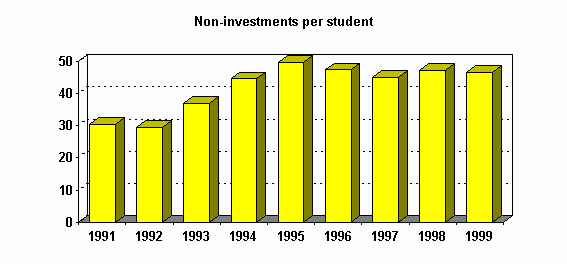
Table 4 - Non-investment means gained from grants between 1992 and 1999 in thousands of CZK
|
Faculty |
1992 |
1993 |
1994 |
1995 |
1996 |
1997 |
1998 |
1999 |
|
FM |
173 |
3 286 |
6 346 |
6 994 |
12 474 |
13 962 |
13 449 |
21 642 |
|
FA |
0 |
2 196 |
2 034 |
4 660 |
4 786 |
6 794 |
2 290 |
5 946 |
|
FL |
28 |
10 |
0 |
88 |
78 |
207 |
251 |
148 |
|
SchSS |
3 354 |
5 851 |
||||||
|
FS |
2 187 |
7 743 |
10 733 |
10 437 |
17 067 |
22 507 |
32 649 |
51 297 |
|
FI |
310 |
2 870 |
934 |
523 |
3 656 |
7 875 |
||
|
FE |
2 930 |
1 196 |
2 021 |
900 |
984 |
1 756 |
1 966 |
2 477 |
|
FEA |
386 |
80 |
157 |
1 048 |
1 282 |
1 496 |
1 952 |
1 884 |
|
Others |
7 888 |
15 134 |
24 631 |
15 133 |
4 027 |
8 683 |
3 578 |
|
|
of this: |
||||||||
|
RO |
0 |
0 |
0 |
500 |
170 |
316 |
156 |
156 |
|
ICS |
0 |
0 |
0 |
21 460 |
14 212 |
2 900 |
7 840 |
3 290 |
|
CDV |
0 |
0 |
0 |
2 671 |
751 |
811 |
687 |
132 |
|
Total |
5 956 |
22 399 |
36 735 |
51 628 |
52 738 |
51 272 |
68 250 |
100 698 |
Table 5 - Investment means gained from grants between 1992 and 1999 in thousands of CZK
|
Faculty |
1992 |
1993 |
1994 |
1995 |
1996 |
1997 |
1998 |
1999 |
|
FM |
0 |
1 260 |
2 500 |
9 526 |
3 823 |
1 832 |
2 879 |
6 468 |
|
FA |
0 |
352 |
519 |
1 524 |
1 499 |
1 123 |
1 380 |
2 746 |
|
FL |
0 |
0 |
0 |
75 |
40 |
594 |
55 |
0 |
|
SchSS |
1 325 |
476 |
||||||
|
FS |
305 |
2 353 |
5 690 |
5 245 |
45 521 |
19 298 |
21 737 |
24 343 |
|
FI |
40 |
2 170 |
3 140 |
1 689 |
7 923 |
3 095 |
||
|
FE |
187 |
233 |
188 |
221 |
138 |
340 |
610 |
187 |
|
FEA |
0 |
45 |
157 |
33 |
0 |
0 |
611 |
0 |
|
Others |
0 |
10 049 |
19 153 |
19 903 |
28 665 |
17 077 |
31 327 |
9 320 |
|
of this: |
||||||||
|
RO |
0 |
0 |
0 |
0 |
30 |
0 |
100 |
0 |
|
ICS |
0 |
0 |
0 |
19 713 |
28 635 |
17 077 |
31 227 |
9 320 |
|
CDV |
0 |
0 |
0 |
190 |
0 |
0 |
0 |
0 |
|
Total |
492 |
14 292 |
28 090 |
38 697 |
82 826 |
41 953 |
67 847 |
46 635 |
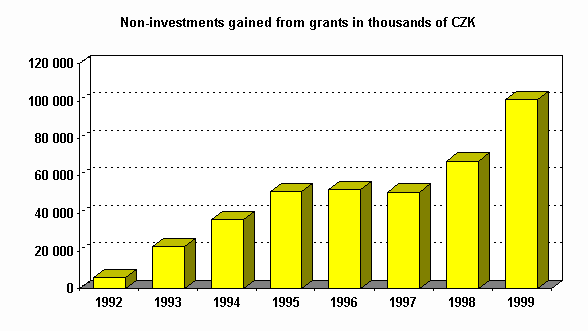
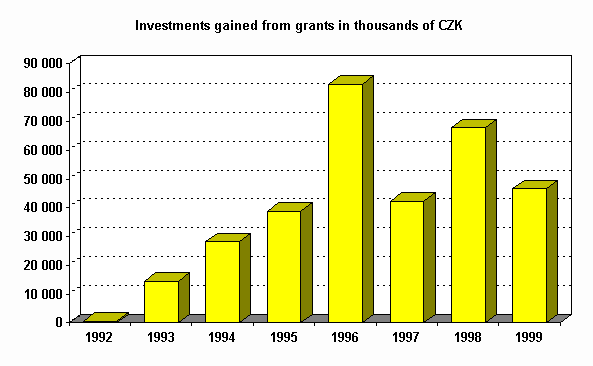
Table 6 - Outlay for salaries gained between 1993 and 1998 in thousands of CZK (1999 - unlimited)
|
Faculty |
1993 |
1994 |
1995 |
1996 |
1997 |
1998 |
1999 |
|
FM |
82 |
834 |
995 |
1 644 |
3 448 |
3 487 |
5 578 |
|
FA |
88 |
932 |
1 405 |
1 286 |
1 845 |
711 |
1 945 |
|
FL |
0 |
0 |
15 |
41 |
42 |
78 |
43 |
|
ScSS |
1 419 |
2 949 |
|||||
|
FS |
238 |
1 510 |
2 375 |
3 440 |
5 971 |
8 071 |
17 693 |
|
FI |
0 |
75 |
40 |
106 |
1 186 |
3 681 |
|
|
FE |
655 |
754 |
146 |
184 |
334 |
629 |
714 |
|
FEA |
137 |
12 |
519 |
294 |
415 |
670 |
578 |
|
Others |
1 810 |
948 |
1 528 |
693 |
504 |
557 |
930 |
|
out this: |
|||||||
|
RO |
0 |
30 |
0 |
80 |
30 |
30 |
49 |
|
ICS |
38 |
188 |
275 |
170 |
158 |
879 |
|
|
CDV |
1 772 |
730 |
1 528 |
338 |
304 |
369 |
2 |
|
Total |
3 010 |
4 990 |
7 058 |
7 622 |
12 665 |
16 808 |
34 808 |
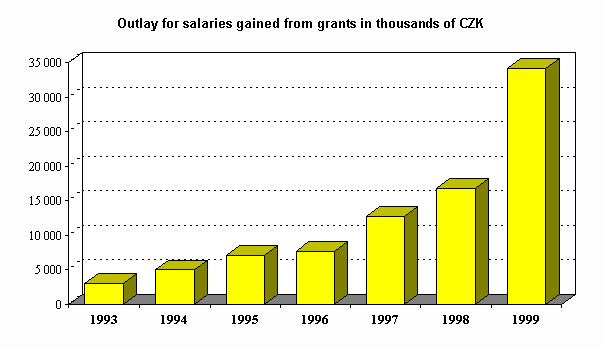
Table 7 - Earnings from supplementary activities between 1991 and 1999 in thousands of CZK
|
Faculty |
1993 |
1994 |
1995 |
1996 |
1997 |
1998 |
1999 |
|
FM |
5 610 |
19 816 |
29 949 |
32 617 |
37 071 |
43 351 |
8 863 |
|
FA |
1 804 |
4 003 |
3 293 |
1 946 |
2 422 |
3 890 |
677 |
|
FL |
9 686 |
19 030 |
14 083 |
20 698 |
18 083 |
20 416 |
3 825 |
|
SchSS |
375 |
231 |
|||||
|
FS |
7 240 |
8 786 |
9 349 |
9 254 |
9 712 |
14 773 |
17 107 |
|
FI |
691 |
180 |
163 |
448 |
|||
|
FE |
1 456 |
465 |
860 |
1 376 |
1 185 |
1 190 |
3 315 |
|
FEA |
1 274 |
2 924 |
3 478 |
2 526 |
3 087 |
3 078 |
5 579 |
|
Others |
5 671 |
11 319 |
24 184 |
31 089 |
27 955 |
29 459 |
24 243 |
|
Total |
32 741 |
66 343 |
85 196 |
100 197 |
99 695 |
116 695 |
64 288 |
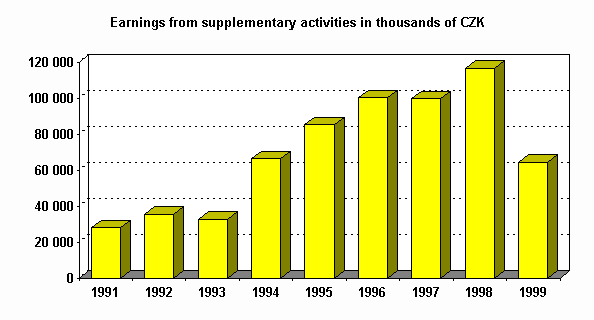
Table 8 - Financial means gained from academics’ grants between 1992 and 1999 in thousands of CZK
|
1992 |
1993 |
1994 |
1995 |
1996 |
1997 |
1998 |
1999 |
|
|
Means from grants |
6 448 |
39 701 |
69 815 |
97 383 |
135 564 |
93 225 |
136 097 |
147 333 |
|
Number of academics |
1 049 |
1 079 |
1 107 |
1 089 |
1 135 |
1 145 |
1 151 |
1 195 |
|
Grant/academic |
6,15 |
36,79 |
63,07 |
89,42 |
119,44 |
81,42 |
118,26 |
123,29 |
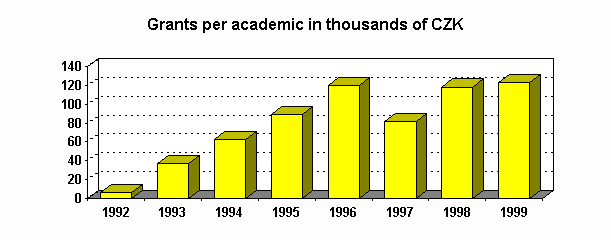
Table 9 – Financial means gained from additional activities per employee between 1991 and 1999 in thousands of CZK
|
1991 |
1992 |
1993 |
1994 |
1995 |
1996 |
1997 |
1998 |
1999 |
|
|
Means from additional activities |
28 070 |
35 583 |
32 741 |
66 343 |
85 196 |
100 197 |
99 695 |
116 695 |
64 288 |
|
Number of employees |
2 182 |
2 232 |
2 309 |
2 309 |
2 275 |
2 435 |
2 448 |
2 477 |
2 497 |
|
Additional activity/employee |
12,86 |
15,94 |
14,18 |
28,73 |
37,45 |
41,15 |
40,72 |
47,11 |
25,75 |
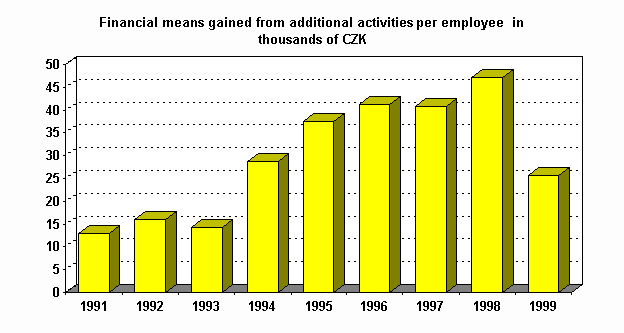
Table 10 - MU employee between 1990 and 1999 (teachers)
|
1990 |
1991 |
1992 |
1993 |
1994 |
1995 |
1996 |
1997 |
1998 |
1999 |
|
|
FM |
315,0 |
314,4 |
322,1 |
320,1 |
309,3 |
305,0 |
290,5 |
294,71 |
293,67 |
303,64 |
|
FA |
159,4 |
173,2 |
175,7 |
179,4 |
183,8 |
188,6 |
186,6 |
191,71 |
170,33 |
171,33 |
|
FL |
50,5 |
57,8 |
62,5 |
69,5 |
71,3 |
73,3 |
70,5 |
74,72 |
76,54 |
73,97 |
|
SchSS |
24,32 |
32,69 |
||||||||
|
FS |
181,2 |
200,4 |
211,0 |
208,4 |
202,5 |
195,3 |
200,0 |
195,86 |
196,76 |
211,74 |
|
FI |
6,6 |
20,7 |
24,5 |
28,32 |
28,66 |
43,38 |
||||
|
FE |
181,9 |
193,5 |
197,7 |
205,5 |
225,8 |
232,5 |
233,5 |
226,97 |
219,40 |
214,56 |
|
FEA |
8,6 |
13,2 |
21,2 |
29,9 |
47,2 |
57,0 |
58,29 |
60,38 |
61,94 |
|
|
Others |
81,4 |
54,2 |
67,0 |
75,0 |
78,2 |
72,6 |
72,7 |
74,06 |
80,75 |
82,04 |
|
Total |
969,4 |
1 002,1 |
1 049,2 |
1 079,1 |
1 107,4 |
1 135,2 |
1 135,3 |
1 144,64 |
1 150,81 |
1 195,29 |
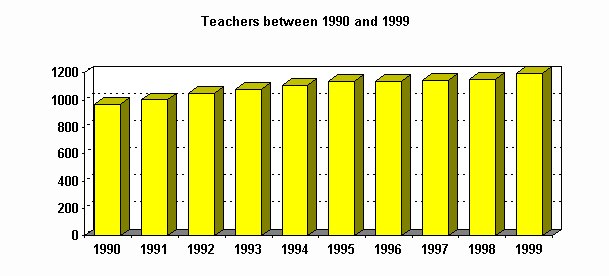
Table 11 - MU employees between 1990 and 1999 (non-teaching staff)
|
Faculty |
1990 |
1991 |
1992 |
1993 |
1994 |
1995 |
1996 |
1997 |
1998 |
1999 |
|
FM |
278,8 |
277,4 |
268,5 |
271,1 |
267,0 |
269,6 |
269,0 |
269,82 |
238,75 |
221,72 |
|
FA |
84,3 |
88,5 |
88,5 |
93,7 |
93,2 |
88,1 |
92,9 |
96,34 |
86,00 |
84,20 |
|
FL |
42,2 |
57,2 |
54,0 |
66,9 |
65,3 |
80,5 |
72,9 |
69,13 |
66,84 |
64,51 |
|
SchSS |
21,31 |
21,87 |
||||||||
|
FS |
234,3 |
223,7 |
226,9 |
234,5 |
232,8 |
245,3 |
247,8 |
264,51 |
277,92 |
276,68 |
|
FI |
19,7 |
36,1 |
40,99 |
53,95 |
48,24 |
|||||
|
FE |
115,1 |
105,9 |
102,1 |
101,1 |
103,3 |
112,9 |
117,3 |
116,71 |
112,03 |
112,16 |
|
FEA |
29,6 |
26,5 |
27,4 |
29,7 |
40,5 |
45,5 |
39,17 |
47,40 |
55,57 |
|
|
Others |
206,3 |
179,9 |
196,3 |
196,4 |
180,5 |
187,7 |
189,5 |
192,96 |
187,25 |
194,44 |
|
SKM |
255,6 |
217,7 |
220,0 |
230,6 |
226,2 |
217,8 |
228,3 |
224,19 |
235,05 |
222,27 |
|
Total |
1 216,6 |
1 179,9 |
1 182,8 |
1 219,7 |
1 202,0 |
1 262,1 |
1 299,3 |
1 313,82 |
1326,50 |
1 301,66 |
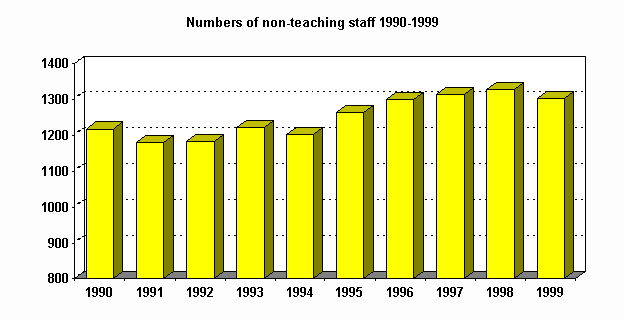
Table 12 - Budget non-investment fianancial means between 1991 and 1999 in thousands of CZK
|
1991 |
1992 |
1993 |
1994 |
1995 |
1996 |
1997 |
1998 |
1999 |
|
296 420 |
312 950 |
425 123 |
518 252 |
637 285 |
728 155 |
751 761 |
851 717 |
909 626 |
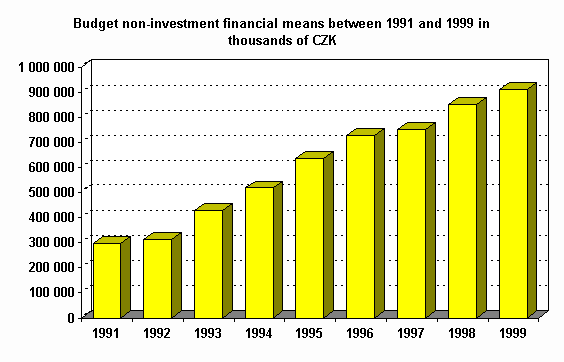
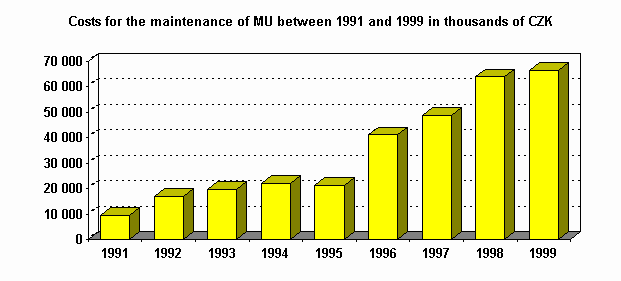
Table 13 - Costs for the maintenance of MU buildings between 1991 and 1999 in thousands of CZK
|
Year |
1991 |
1992 |
1993 |
1994 |
1995 |
1996 |
1997 |
1998 |
1999 |
|
Amount |
9 451 |
17 061 |
19 738 |
22 155 |
21 192 |
41 023 |
48 685 |
63 833 |
66 458 |
|
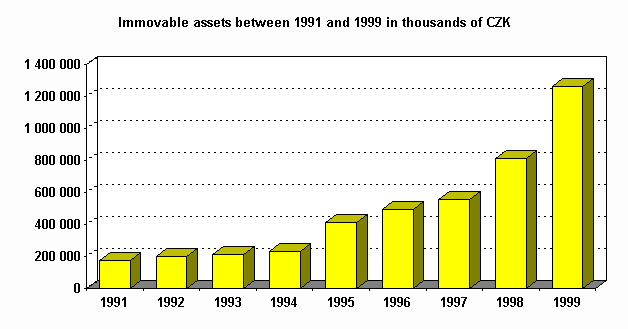
Table 14 - Immovable assets between 1991 and 1999 in thousands of CZK |
||||||||
|
1991 |
1992 |
1993 |
1994 |
1995 |
1996 |
1997 |
1998 |
1999 |
|
172 768 |
198 978 |
214 478 |
232 465 |
410 972 |
490 902 |
556 326 |
811 241 |
1 260 731 |
|
Table 15 - MU movable assets between 1991 and 1999 in thousands of CZK |
||||||||
|
1991 |
1992 |
1993 |
1994 |
1995 |
1996 |
1997 |
1998 |
1999 |
|
372 787 |
418 367 |
461 685 |
506 541 |
614 659 |
728 618 |
828 203 |
938 231 |
1 154 398 |
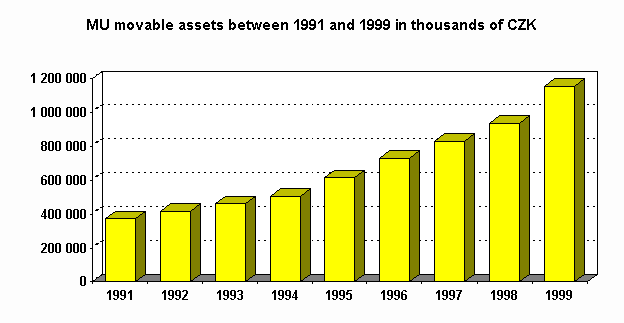
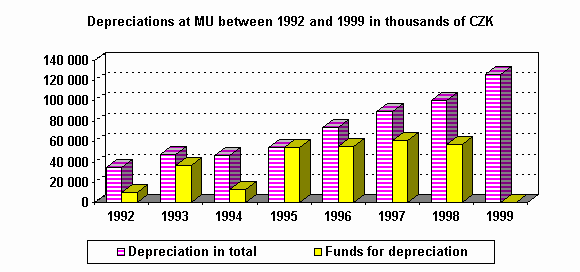
Table 16 - Depreciations at MU between 1992 and 1999 in thousands of CZK
|
1992 |
1993 |
1994 |
1995 |
1996 |
1997 |
1998 |
1999 |
|
|
Property depreciations |
35 220 |
36 395 |
39 696 |
44 946 |
60 755 |
79 169 |
94 963 |
125 535 |
|
Depreciations from economic result of previous year |
11 210 |
6 329 |
9 729 |
12 843 |
10 000 |
5 181 |
0 |
|
|
Total depreciation |
35 220 |
47 605 |
46 025 |
54 675 |
73 598 |
89 169 |
100 144 |
125 535 |
|
Funds for depreciations |
10 000 |
36 355 |
13 588 |
54 435 |
55 397 |
60 801 |
57 544 |
0 |
